Bitcoin November 2026: The Midterm Curse — 3 Crashes, 3 Bottoms, and the 5 Dates That Decide It
Bitcoin enters November 2026 at $77,000 after a $300 billion October wipeout — and history is brutal: every midterm November since 2014 has ended in a crash, yet all three marked the cycle bottom. Here are the 5 dates that decide which version of history repeats.

Bitcoin enters November 2026 at roughly $77,000, down about 39% from its October 2025 record high — and history delivers a warning that should make every holder pay attention. In all three US midterm election years since 2014, Bitcoin crashed in November. Yet all three of those crashes also marked the bottom of the cycle. November 2026 will decide which half of that pattern repeats, and five dates on the calendar will do most of the deciding.
This is not another generic price prediction. It is a data-driven look at what actually happened in every midterm November, what the numbers say about the month ahead, and the exact levels and dates that will tell you whether Bitcoin is repeating a crash — or repeating a bottom.
Where Bitcoin Stands on November 1
Bitcoin traded near $77,177 on the morning of Saturday, October 31, according to CoinGecko data, down 0.9% over 24 hours and 4.3% over the past seven days. The 24-hour range ran from $76,338 to $78,638, and the market capitalisation stood at about $1.55 trillion. At that price, Bitcoin sits roughly 38.8% below its all-time high of $126,080, set in October 2025.
The rest of the market looks just as bruised. Ethereum traded near $2,241, Solana slipped to about $95.88, BNB held near $702, and XRP eased to $1.25. Total crypto market capitalisation stood at roughly $2.7 trillion, and the Fear and Greed Index read 30 — firmly in Fear territory, down from 51 a week earlier and 74 a month earlier.
October itself was brutal. Roughly $300 billion in total crypto market value was wiped out during the month, according to Cointelegraph, turning the famous "Uptober" rally into one of the worst Octobers on record. The damage accelerated in the final week: US spot Bitcoin ETFs recorded $643.33 million in net outflows on Friday, October 30, led by BlackRock's IBIT at $233.70 million and Fidelity's FBTC at $201.04 million, while about $427 million in leveraged positions were liquidated in 24 hours, hitting roughly 93,000 traders. If you want the full story of that washout, read our breakdown of what a crypto liquidation is — and the five leverage mistakes that cost 93,000 traders $427 million.
The Midterm Curse: 3 Elections, 3 Crashes
Here is the pattern that makes November 2026 genuinely unusual. In each of the last three US midterm election years, Bitcoin was already deep in a bear market by election day — and it fell further afterwards.
In November 2014, Bitcoin traded at approximately $340 on election day, already more than 69% below its 2013 peak of $1,100. It then fell below $170 by mid-January 2015. In November 2018, Bitcoin stood at roughly $6,400 on election night — and collapsed a further 50% to about $3,200 by December 15. In November 2022, Bitcoin traded near $15,900 on election day, roughly 77% below its 2021 peak of $69,000, and hit about $15,800 two weeks later as the FTX bankruptcy unfolded.
That is three midterms, three crashes, and — crucially — three cycle lows. December 15, 2018 marked a low Bitcoin has never traded below since. The January 2015 low and the November 2022 low did the same job in their cycles. The crash and the bottom were the same event, separated only by weeks of pain.
The 2026 setup rhymes with those years in an uncomfortable way. Bitcoin approaches the November 3, 2026 midterm vote roughly 36–39% below its record high — a smaller drawdown than the 67% of 2018 or the 73% of 2022, but the same structural position: a wounded market heading into a politically charged month. Our earlier analysis of the US midterms and the Bitcoin Clarity Act explains why the vote matters for crypto regulation beyond the price chart.
November's Real Record: The Average Lies to You
Bitcoin's November reputation is one of the most misleading statistics in crypto. Headlines call November Bitcoin's best month, citing an average gain of about 46% across 2013–2024. That average is almost entirely a mirage created by a single month: November 2013, when Bitcoin surged 449.35%.
Strip out that one outlier and the average November gain falls to roughly 9.35%. The median November return — the middle outcome, and a far better guide to a "typical" November — is about 10.82%. And in the most recent window, the record is poor: Bitcoin rose in only three of the last eight Novembers.
| November | Bitcoin return | What happened |
|---|---|---|
| 2018 | -36.57% | Midterm year; collapse to the $3,200 cycle low |
| 2019 | -17.27% | Post-rally fade after the summer peak |
| 2020 | +42.95% | Post-halving bull run accelerates |
| 2021 | -7.11% | Cycle top month; the peak came and went |
| 2022 | -16.23% | Midterm year; FTX collapse drives the cycle low |
| 2023 | +8.81% | Steady recovery year |
| 2024 | +37.29% | Post-election surge after the US presidential vote |
| 2025 | Negative | November closed red, extending the losing run |
The lesson is not that November is doomed. It is that November is extreme: the month has delivered both cycle tops (2013, 2017, 2021) and cycle bottoms (2018, 2022). Betting on "November is always green" is betting on an average that no actual November resembles. For a primer on reading these swings without getting fooled by averages, see our beginner's guide to reading crypto charts.
What Most People Get Wrong About the Midterm Pattern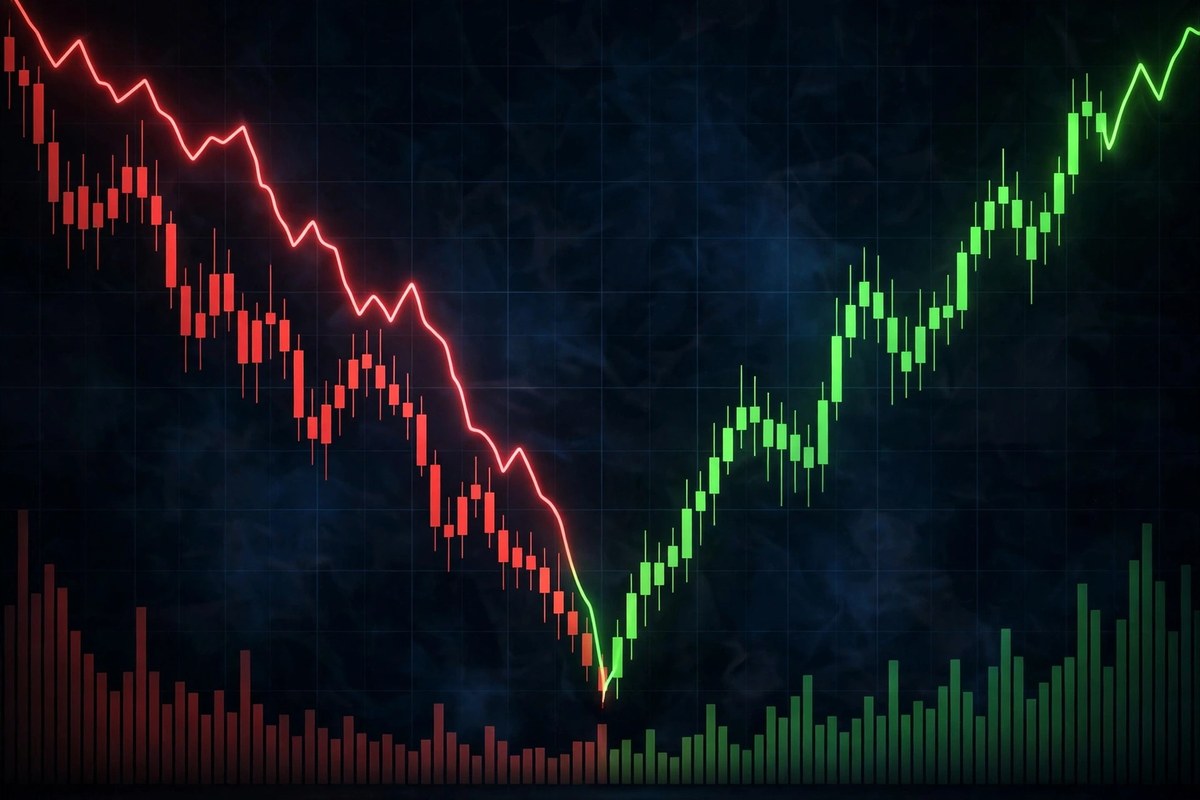
The midterm pattern is real as a historical observation — and badly misunderstood as a prediction. Three points matter before anyone trades on it.
First, correlation is not causation. No statement from the Federal Reserve, the SEC, or any major exchange has linked midterm elections to Bitcoin's price. The 2022 crash was driven by the FTX bankruptcy, not by ballots. The 2018 crash was a bear-market capitulation that happened to land after election day. Treating the vote itself as the cause mistakes coincidence for mechanism.
Second, the sample is tiny — and confounded. There are only three modern observations, and midterm years run on the same four-year rhythm as Bitcoin's halving cycle. Every post-midterm window also covers the run-up to the next halving, which is expected in spring 2028. With two clocks ticking at the same speed, history cannot tell us which one drives the price.
Third, the famous "buy the midterm" statistic hides the drawdown. Measured from election day to one year later, Bitcoin gained 24.1% after 2014, 44.9% after 2018, and 92.1% after 2022 — an average of 53.7%. But anyone who bought on election night in 2018 watched their position halve within six weeks before that gain arrived. The statistic is true, and it is also a warning: the path to the gain ran straight through maximum pain. Calendar years after midterms tell the same story in the other direction: Bitcoin rose 34% in 2015, 94% in 2019, and 155% in 2023, according to Binance Research data.
The 5 Dates That Decide November 2026
If history sets the stage, the November calendar writes the script. These are the five dates that will move Bitcoin most — and what to watch on each one.
November 2: Binance Proof of Reserves and ETF Flows
Monday, November 2 is the first real test. Binance has targeted a phased restart of withdrawals and proof-of-reserves results by November 2, after setting aside more than $6.34 billion to cover its record $6.3 billion hack. At the same time, Monday's spot ETF flows will show whether Friday's $643 million outflow was panic or the start of a trend. October already proved flows can reverse fast: the funds lost $635.6 million on October 22, then took in about $424 million across three sessions from October 26–28. Watch whether Monday prints inflows or a second straight week of redemptions.
November 3: The US Midterm Elections
The vote itself decides the regulatory backdrop for the Clarity Act and the balance of power over crypto legislation. But for price, the history above is the guide: in all three prior midterms, the weeks after the vote — not the vote itself — delivered the decisive move. Do not judge November by election night; judge it by mid-November.
November 6: The October Jobs Report
September delivered only 29,000 new jobs, and the October report lands on November 6. A weak number strengthens the case against a December rate hike; a hot number does the opposite. With prediction markets pricing a December hike at roughly 79–86%, jobs data is the first hard evidence that can move those odds.
November 10: October Consumer Prices
September CPI rose 3.7% from a year earlier, and the Fed's October 28 decision — holding rates at 3.75% to 4% on a 10–2 vote, with two officials voting for a hike — made clear that inflation remains the obstacle. The October CPI print on November 10 is the single most important macro release of the month for Bitcoin. Hot inflation keeps borrowing costs high and the dollar supported, both headwinds for crypto. Cool inflation reopens the path to the $81,000 breakout level.
December 9: The Fed's Next Decision
November ends with the December 9 Fed meeting already in focus. The Fed held steady in October while warning that inflation remains elevated, and markets now price a December hike as the likely outcome. If November's data softens that pricing, Bitcoin gets a tailwind into year-end. If it hardens, the bear case gains its strongest argument. Either way, traders will position for December 9 throughout late November — which means late-November volatility is almost guaranteed.
Bull, Base, and Bear: 3 Scenarios for November
Levels turn this story into something usable. Analysts tracking the current structure put the key zones as follows: the $75,000–$75,500 support zone is the line November must defend, the $76,300 area — Bitcoin's October 31 low — is the nearest trigger, and a sustained breakout above $81,000 opens a route toward $85,000 and then $87,000. Note the trap in between: a recovery toward $79,000 or $80,000 still fits inside the descending channel of lower highs and lower lows, and would not by itself change the broader direction.
| Scenario | Trigger | Target | What it means |
|---|---|---|---|
| Bear case | Break below $76,300, then $75,000 | $72,000–$75,000 zone | Midterm curse repeats; capitulation risk rises |
| Base case | Chop between $76,000 and $81,000 | Sideways into CPI and jobs data | Market waits for November 6 and 10 before choosing |
| Bull case | Daily close above $81,000 | $85,000, then $87,000 | Breakout breaks the downtrend; midterm bottom thesis gains |
The base case deserves emphasis because it is the most likely and the least exciting — and therefore the one most traders mishandle. A market that chops between $76,000 and $81,000 for two weeks is not "doing nothing." It is accumulating evidence. Every ETF flow print, every jobs and CPI release, and every Binance update either defends the $75,000 floor or cracks it. Patience through that chop is a strategy, not a failure to act.
November Checklist: What Smart Holders Do Now
None of this is financial advice — it is a checklist for navigating a historically violent month with your capital intact.
- Check ETF flows every Monday before judging the week: single-day outflows reversed twice in October, so one red print is noise and two weeks of red is signal.
- Watch the $75,000–$75,500 support zone first and headlines second: price levels confirm or kill narratives faster than any pundit.
- Avoid fresh leverage until after the November 10 CPI print: October's $427 million liquidation wave showed how fast leveraged longs get wiped out in this market.
- Separate the midterm vote from the midterm aftermath: history says the decisive move came weeks after election day, not on the night itself.
- Revisit your exit plan before volatility arrives, not during it: our guide to when to sell Bitcoin and how to build a profit-taking plan covers the framework.
- Keep some dry powder for a capitulation wick: if the midterm curse repeats, the cycle-low pattern says the worst weeks have historically been the best buying weeks — but only for money you can afford to leave untouched for a year.
For newcomers trying to make sense of all of this, our best crypto for beginners guide and our comparison of Bitcoin versus stocks as a 2026 investment put November's drama in a longer-term context. And if October's crash already has you rattled, our look at Bitcoin's worst October since 2014 explains how the month that just ended set up the month ahead.
The Bottom Line
November 2026 is a genuine fork in the road, and history refuses to pick a side. The midterm curse says crash: three elections, three November sell-offs, three trips toward cycle lows. The midterm bottom says opportunity: those same three crashes marked the lowest prices of their cycles, and the year after each midterm delivered gains of 24%, 45%, and 92%.
Both halves of that history can be true at once — a November crash followed by a bottom is exactly what happened in 2014, 2018, and 2022. The question for 2026 is not whether November will be volatile. It will be. The question is whether Bitcoin defends $75,000 through the jobs report and CPI print, or whether the midterm curse claims a fourth victim before the bottom pattern gets its chance. Watch November 2, 3, 6, and 10. They will tell you before the pundits do.
Frequently Asked Questions
Is November a good month for Bitcoin historically?
On average, yes — but the average is misleading. November's mean return from 2013–2024 was about 46%, almost entirely because of the 449% surge in November 2013. The median November return is roughly 10.82%, and Bitcoin rose in only three of the last eight Novembers. November is historically extreme, delivering both cycle tops and cycle bottoms, not reliably green.
What happened to Bitcoin in past midterm election years?
Bitcoin crashed in November in all three modern midterm years: it traded near $340 in 2014 and fell below $170 by January 2015, stood near $6,400 in 2018 and halved to $3,200 by December 15, and traded near $15,900 in 2022 before the FTX collapse drove the cycle low. In all three cases, the post-election low marked the cycle bottom, and Bitcoin gained an average of 53.7% in the year after each vote.
What price levels matter most for Bitcoin in November 2026?
The $75,000–$75,500 zone is the key support to defend, with $76,300 as the nearest trigger after Bitcoin's October 31 low. A recovery to $79,000–$80,000 would still sit inside the descending channel. A sustained breakout above $81,000 would open a route toward $85,000 and then $87,000.
Which November dates will move Bitcoin most?
November 2 (Binance proof of reserves and Monday ETF flows), November 3 (US midterms), November 6 (October jobs report), November 10 (October CPI), and December 9 (the Fed's next decision, which November data will price). CPI on November 10 is the single most important macro release of the month.
Does the midterm election cause Bitcoin to crash?
There is no evidence of causation. The sample is only three elections, midterm years share Bitcoin's four-year halving rhythm, and the 2022 crash was driven by FTX, not by the vote. The pattern is a historical observation worth respecting for risk management — not a causal law to trade blindly.
Should I buy Bitcoin before November 2026 ends?
History offers both arguments: midterm Novembers crashed, but their lows marked cycle bottoms and the following years gained 34%, 94%, and 155%. The disciplined approach is to watch the $75,000 support zone and the November 6 and 10 data releases, avoid leverage in a month famous for liquidations, and only invest money you can leave untouched for a year or more. This article is not financial advice.
Sources: CoinGecko price data via Crypto Times and CoinCentral; November seasonality via GeekMetaverse and BTCC/Coinglass; midterm analysis via WEEX and WEEX election statistics; November outlook and levels via Coinspeaker and CaptainAltcoin.