How to Read Crypto Charts: Beginner's Guide to Crypto Technical Analysis (2026)
Learn how to read crypto charts in 2026: candlesticks, timeframes, support and resistance, moving averages, RSI, MACD, volume and chart patterns — a beginner's complete technical analysis guide.
Every day, millions of crypto traders stare at the same green and red candles and see two completely different things: noise or opportunity. The difference between them isn't luck — it's the ability to read a crypto chart. Whether you want to buy Bitcoin near a dip, spot when Ethereum is running out of momentum, or simply understand what analysts mean when they say "BTC is testing the 50-day EMA," learning the basics of technical analysis is one of the highest-value skills in crypto.
This guide teaches you how to read crypto charts from scratch in 2026 — candlesticks, timeframes, trend lines, support and resistance, moving averages, RSI, MACD, volume, and the classic chart patterns professionals actually use. No math degree required.
Why Crypto Charts Matter (and Why They Differ From Stock Charts)
Crypto markets trade 24/7, with no opening bell or closing auction. That means crypto charts never have overnight "gaps" the way stock charts do, and weekend moves can be just as violent as weekday ones. Prices on exchanges like Coinbase, Binance, and Kraken react instantly to ETF flows, macro data, and even a single viral post.
Technical analysis is the study of price and volume history to estimate where price might go next. It rests on three assumptions: prices reflect all known information, prices move in trends, and history tends to repeat because market participants react in similar ways under similar conditions. Fundamentals tell you what to buy; charts help you decide when to buy. If you're still learning the basics of the asset itself, start with our complete beginner's guide to how Bitcoin works and the beginner's guide to Ethereum before diving into timing tools.
Candlesticks: The Alphabet of Crypto Charts
Nearly every crypto chart you'll encounter uses candlesticks — each candle summarizes one time period's trading. A candle has a "body" (the range between the open and the close) and "wicks" or "shadows" (the period's high and low).
- Green (bullish) candle: price closed higher than it opened. The bottom of the body is the open, the top is the close.
- Red (bearish) candle: price closed lower than it opened. The top of the body is the open, the bottom is the close.
- Long bodies: strong conviction — buyers or sellers dominated the period.
- Long wicks, small body: indecision or rejection — price explored one direction and was pushed back. A long lower wick near support often signals buyers stepping in.
Common single-candle signals include the doji (open ≈ close, market indecision), the hammer (long lower wick after a decline — potential bullish reversal), and the shooting star (long upper wick after a rally — potential bearish reversal). These signals carry far more weight at major support or resistance levels than in the middle of nowhere. According to Investopedia's candlestick reference, pattern context is what separates a meaningful signal from nois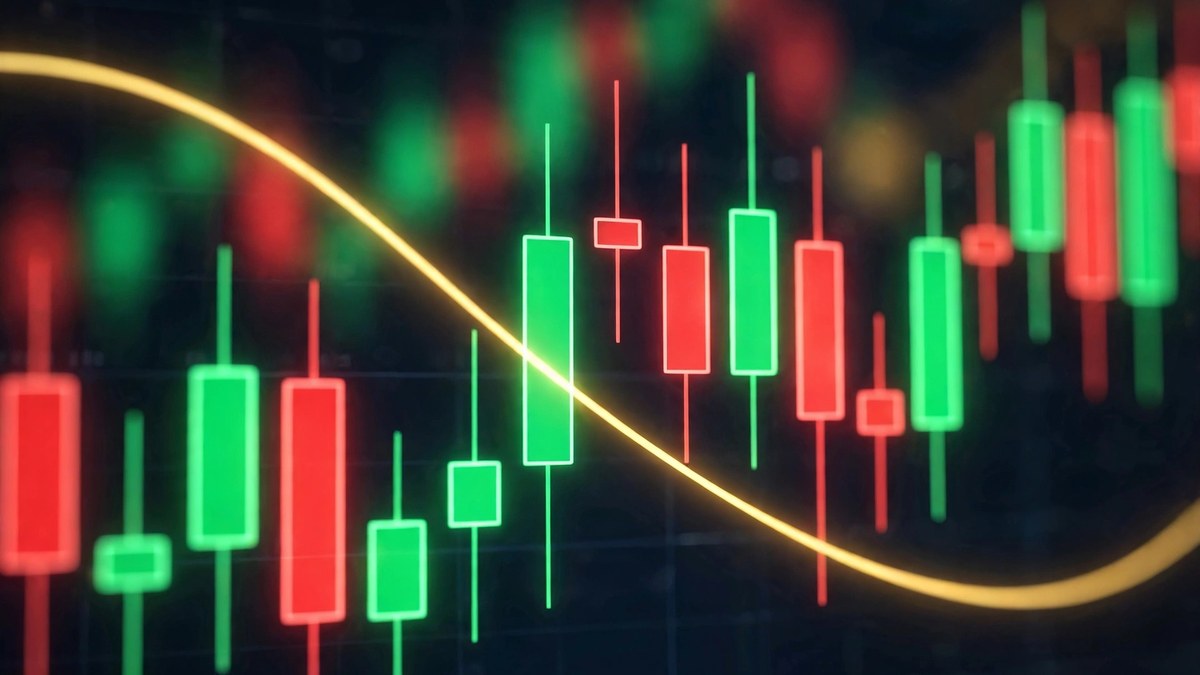 e.
Choosing the Right Timeframe
The same coin can look bullish on one timeframe and bearish on another. Timeframe choice must match your trading style:
- 1-minute / 5-minute: scalping and intraday trading — very noisy, mostly for professionals.
- 1-hour / 4-hour: short-term swings; analysts often quote these (e.g. "BTC below the H4 MA-20").
- Daily: the workhorse timeframe for most investors — one candle per day, far less noise.
- Weekly / Monthly: long-term trend and cycle analysis; ideal for spotting macro tops and bottoms.
Best practice: analyze top-down. Check the weekly chart for the big trend, the daily for trade setups, and the 4-hour for entry timing. Never trade a 1-hour signal that fights the weekly trend. Most charting platforms, including TradingView, let you flip between timeframes on the same asset instantly.
Trend Lines: The Market's Direction in One Stroke
A trend line connects a series of higher lows in an uptrend or lower highs in a downtrend. The more times price touches the line and bounces, the more significant it becomes — but a trend line is broken once price closes decisively beyond it.
Bitcoin's 2026 price action is a textbook example: BTC has repeatedly bounced within a broad ascending channel since the June lows, with the $86,000–$87,000 zone capping rallies and the channel midline near $80,000 acting as support. When analysts say the "structure remains intact," they mean the trend line is holding. For the live version of that analysis, see our Bitcoin $100K price-prediction analysis.
Support and Resistance: Where Battles Are Won and Lost
Support is a price level where buying pressure has historically overwhelmed selling pressure (price bounces up). Resistance is the mirror image — selling pressure overwhelms buyers (price gets rejected down). Both are zones, not exact lines.
- Psychological round numbers ($80,000, $100,000) act as magnets and battlegrounds.
- Role reversal: broken resistance often becomes new support, and broken support often becomes new resistance.
- Confluence: a level is strongest when multiple factors align — e.g. a horizontal level + a moving average + a round number.
Ethereum's recent behavior shows confluence in action: ETH held above its 100-day and 200-day exponential moving averages near $2,365 and $2,317 while remaining capped below the 50-day EMA around $2,475 — a textbook support-resistance sandwich. Our Ethereum $5,000 prediction breakdown walks through those levels in detail.
Moving Averages: Smoothing the Noise
A moving average (MA) is the average price over the last N periods, recalculated continuously. The two most-used are the simple moving average (SMA) and the exponential moving average (EMA), which weights recent prices more heavily and reacts faster.
- 20 / 50-day: short-term trend gauges. Price above them suggests bullish momentum.
- 100 / 200-day: long-term trend gauges. BTC holding above its 200-day MA is a classic bull-market confirmation; the famous "death cross" (50-day crossing below the 200-day) warns of deeper downtrends.
- Dynamic support/resistance: moving averages themselves act as bouncing points — Bitcoin's recent defense of its 50-day EMA near $80,878 is a live example.
Use moving averages to define the trend and locate value zones, not as standalone buy/sell buttons. A dip to the 50-day EMA in an uptrend is often a higher-probability entry than chasing a vertical rally.
RSI: Measuring Momentum Before It Breaks
The Relative Strength Index (RSI) is a 0–100 oscillator measuring how fast price is moving. Readings above 70 suggest overbought conditions (a pullback may be near); below 30 suggests oversold conditions (a bounce may be near). Bitcoin's daily RSI recently hovered near 47 — neutral territory, neither confirming strength nor signaling exhaustion.
The advanced use of RSI is divergence: if price makes a new high but RSI makes a lower high (bearish divergence), momentum is fading even though price looks strong — a classic early warning. Divergences at major resistance levels are among the highest-probability reversal signals in technical analysis. Pair RSI readings with market mood gauges like the Crypto Fear and Greed Index for a fuller picture.
MACD: Trend and Momentum in One Tool
The Moving Average Convergence Divergence (MACD) shows the relationship between two EMAs (usually 12- and 26-period). When the MACD line crosses above the signal line, momentum is shifting bullish; a cross below is bearish. The histogram visualizes that momentum — growing bars mean acceleration, shrinking bars mean deceleration.
MACD works best in trending markets and lags in sideways chop, which is why professionals use it to confirm trends identified on price structure rather than as a lone signal. Bitcoin's MACD recently sat slightly negative while price held key support — a neutral-to-cautious read that matches the consolidation phase.
Volume: The Fuel Behind Every Move
Volume is the most underused indicator by beginners — yet a price move without volume is a move without conviction. Healthy breakouts happen on expanding volume; rallies on shrinking volume are fragile and prone to reversal.
- Breakout + volume surge: genuine — new money is entering.
- Breakout + weak volume: suspect — likely a fake-out or short squeeze.
- Decline on falling volume: selling pressure may be exhausting — watch for a reversal.
On-chain and derivatives data add another layer: record open interest in Bitcoin futures recently signaled extreme leverage positioning, which often precedes sharp liquidations. Watch volume at the levels that matter — a support test with heavy buying volume is far more meaningful than one with a whisper of volume.
Classic Chart Patterns Every Beginner Should Know
Patterns are simply support, resistance, and trend lines forming recognizable shapes. The essentials:
- Head and shoulders / inverse head and shoulders: three-peak reversal patterns; the "neckline" break confirms the reversal.
- Double top / double bottom: two failed attempts at the same level — reversal signals.
- Ascending / descending triangles: flat resistance with rising support (bullish) or flat support with falling resistance (bearish) — continuation patterns.
- Bull / bear flags: sharp move (pole), brief consolidation (flag), then continuation. Measure the pole's height and project it from the breakout for a rough target.
- Wedges: converging trend lines; rising wedges in uptrends often break down, falling wedges in downtrends often break up.
Pattern success rates improve dramatically when combined with volume confirmation and when they form at larger-timeframe support or resistance. CoinMarketCap and CoinGecko both offer free charting views where you can practice spotting these patterns on real coins.
Putting It All Together: A Real-World Example
 Let's apply the toolkit to Bitcoin's October 2026 setup. BTC trades near $81,800 after repeated rejections at the $84,000–$86,000 resistance zone — a sequence of lower highs, a bearish structural signal. On the daily chart, price sits just above the 50-day EMA (~$80,878) and well above the 200-day EMA (~$76,186): the long-term uptrend is intact, but short-term momentum is weak.
The RSI near 47 is neutral, while a slightly negative MACD confirms momentum hasn't turned. The bullish case requires a daily close above $85,000 with expanding volume; the bearish case triggers on a decisive close below the 50-day EMA, opening the 100-day EMA near $77,528. That's not financial advice — it's how analysts translate chart data into trade scenarios: levels, conditions, and confirmation, not predictions from thin air.
Beginner Mistakes That Destroy Trading Accounts
- Trading every signal: indicators conflict constantly; only act when price structure, momentum, and volume agree.
- Ignoring the higher timeframe: a bullish 15-minute pattern inside a daily downtrend is a trap, not an opportunity.
- No stop-loss: every setup can fail. Risk a fixed small percentage per trade (1–2% is the standard guideline) and place stops where the setup is invalidated — not where you hope price stops.
- Revenge trading: doubling down after a loss to "win it back" is the fastest path to liquidation.
- Chasing vertical moves: buying after a 20% daily pump is buying someone else's exit liquidity.
If you're new to actually owning crypto, read our step-by-step guide to buying Bitcoin and our explainer on Bitcoin dominance to understand which part of the market cycle you're analyzing.
Frequently Asked Questions
Does technical analysis actually work on crypto?
It works as a probability tool, not a crystal ball. Crypto is sentiment-driven and volatile, so signals fail more often than in mature markets — but disciplined traders use charts to define entries, stops, and targets, which beats guessing. Studies of trend-following and momentum strategies consistently show that defined rules outperform emotional decisions over time.
Which indicator is the best for crypto trading?
No single indicator wins. Price structure (trend lines, support/resistance) is the foundation; RSI and MACD measure momentum; volume confirms. Professionals layer 2–3 tools that measure different things rather than stacking five momentum indicators that all say the same thing.
What timeframe should beginners use?
The daily chart. It's slow enough to filter noise and fast enough to stay relevant. Check the weekly for trend direction and the 4-hour for fine-tuning entries — the classic top-down approach.
Can I predict Bitcoin's exact price with charts?
No — charts give scenarios, not certainties. A proper analysis says "if BTC closes above $85,000 with volume, the next target is $87,500; if it loses $80,878, expect $77,528." Anyone promising an exact price on an exact date is selling you something.
Are free charting tools good enough?
Absolutely. TradingView's free tier covers everything in this guide, and every major exchange (Coinbase, Kraken, Binance, Bybit) includes solid built-in charts. Paid tools add conveniences, not magic.
Should I learn technical analysis before buying my first crypto?
Understand what you're buying first, then learn timing. Our beginner guides on Bitcoin, Ethereum, and Bitcoin vs Ethereum cover the fundamentals; this guide covers the timing.
Conclusion: Charts Are a Language — Learn to Speak It
Reading crypto charts is a learnable skill, not a talent. Start with candlesticks and one timeframe, add support and resistance, then layer in moving averages, RSI, MACD, and volume one at a time. Practice on historical charts — scroll back, cover the right side of the screen, and test whether your reads would have worked. Track your hit rate honestly.
Above all, remember what charts can and cannot do: they map probabilities, manage risk, and keep emotions in check — they don't predict the future. Combine technical analysis with solid fundamentals, strict position sizing, and patience, and you'll already be ahead of most market participants. The charts are speaking every day; now you can listen.