Dogecoin Death Cross at $0.072: DOGE's First Death Cross of 2026 Came Just 3 Weeks After a Golden Cross — 5 Levels That Decide What's Next
Dogecoin just printed its first death cross of 2026 at $0.072 — only 3 weeks after a golden cross, the shortest flip in DOGE history. Here are the 5 levels that decide whether it falls to $0.0676 or reclaims $0.086.

Dogecoin just printed its first death cross of 2026 — and it arrived only three weeks after a golden cross, the shortest bullish-to-bearish flip in DOGE history. The memecoin fell to $0.072 on Friday, October 30, its lowest level since August, before steadying near $0.075. If you hold DOGE, five price levels now decide whether this is a washout to buy or the start of months of grinding lower.
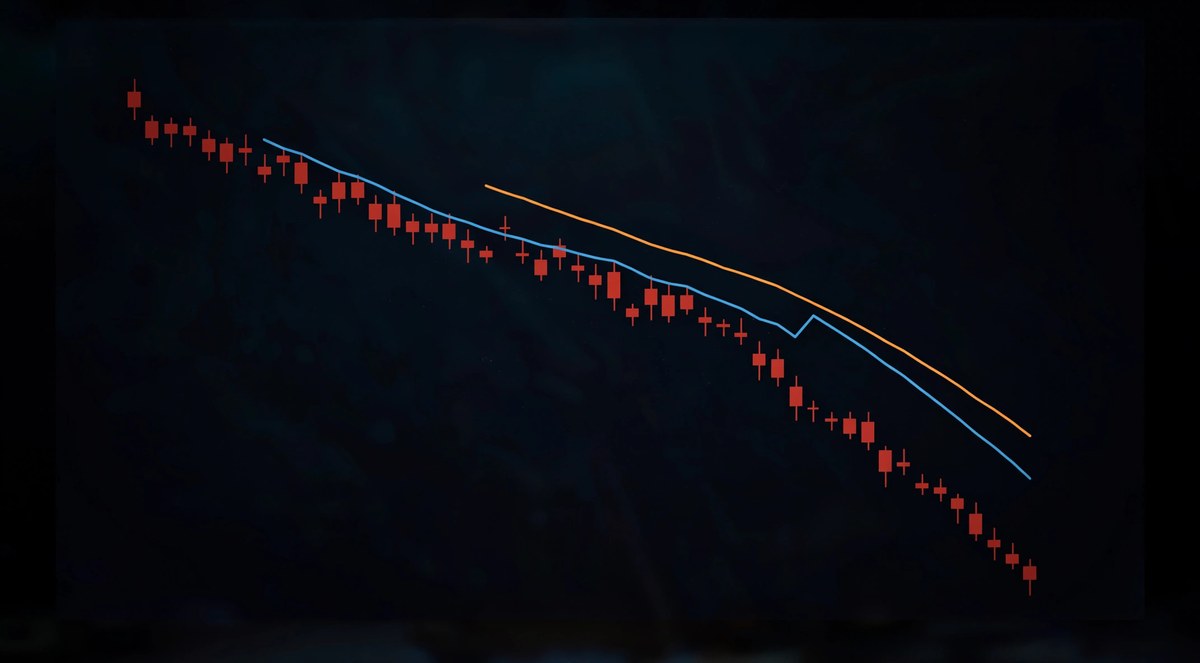
The signal itself is simple: Dogecoin's 50-day moving average crossed below its 200-day moving average on the daily chart. Traders treat that crossover as a bearish trend signal — but the context around this one makes it unusual. The last time DOGE printed a daily death cross, in November 2025, it was followed by months of downward price action. This time, the market flipped from golden cross to death cross in about 21 days, a whiplash that says more about how violent this market has become than about any single indicator.
This article breaks down what actually happened, why the signal fired now, what the November 2025 precedent really says, and the five levels that will confirm or kill the bearish case — plus a checklist for DOGE holders deciding what to do next.
What Happened: DOGE Falls to $0.072 as the Death Cross Confirms
Dogecoin's 50-day simple moving average (SMA) crossed below its 200-day SMA on October 30, 2026, completing the first daily death cross of the year, according to multiple market reports. The confirmation landed on the same day DOGE slid to $0.072, a level last seen in August 2026. At the time of writing, the token was trading around $0.075, having recovered slightly from the low.
The path to the cross was a study in whiplash. DOGE rallied for three straight sessions into October 29, reaching a local high of $0.081, before momentum faded and the token dropped to $0.074 on Thursday and then to $0.072 on Friday. The decline coincided with a broader market sell-off: CoinGlass data showed $1.68 billion in total crypto liquidations over 24 hours, with long positions accounting for $1.43 billion of the total — traders betting on higher prices absorbed the overwhelming majority of the damage.
The trigger for the wider sell-off was the $6.3 billion security breach at Binance, the largest crypto theft on record, disclosed on October 29. Bitcoin fell to about $77,000 and U.S. spot Bitcoin ETFs posted $643 million in net outflows on Friday. Dogecoin, a high-beta asset with thin liquidity relative to Bitcoin, felt the move harder than the majors. For the full picture of how that hack rippled through the market, see our Binance hack explainer — but the DOGE story has its own distinct mechanics, and they matter more for holders than the headline.
What a Death Cross Actually Is — and What It Is Not
A death cross happens when a shorter-term moving average falls below a longer-term one. In this case, the 50-day SMA — the average closing price over the last 50 days — dropped below the 200-day SMA, the average over the last 200 days. Because the 200-day line moves slowly, the cross means recent price action has weakened enough to drag the medium-term trend below the long-term trend.
Trend-following funds and systematic strategies watch this relationship closely, which is why the cross itself can trigger selling: some of the selling that follows a death cross happens because the signal fired, not because of any new fundamental information. That self-fulfilling element is worth remembering before treating the pattern as a prophecy.
What a death cross is not: a guarantee. It is a lagging indicator — it describes what prices have already done, not what they will do next. It does not set a price target or a deadline, and it has produced false signals in choppy markets before. The honest way to use it is as a trend filter: while the cross is in place, rallies should be treated as guilty until proven innocent. If you are new to reading these signals, our beginner's guide to crypto technical analysis explains moving averages, RSI and MACD in plain language.
 The 3-Week Whiplash: Golden Cross to Death Cross in 21 Days
Here is the detail that makes this death cross genuinely unusual. On October 5, 2026, Dogecoin's 50-day average crossed above its 200-day average — a golden cross, the bullish mirror image, widely read as improving medium-term momentum. Barely three weeks later, the averages crossed back in the opposite direction.
Dogecoin community member Krisspax flagged the sequence on X, calling it the shortest crossover of this type he had seen on the DOGE chart and writing that it "stresses the volatility of Dogecoin trading." He is right, and the point deserves emphasis: a golden cross that survives only three weeks was never a trend change. It was a bear-market rally inside a longer downtrend, and the death cross is the market admitting it.
That whiplash is also a warning about how traders should treat the next golden cross, whenever it comes. A single crossover is not a regime change. Confirmation — price holding above the moving averages and improving momentum — is what separates a real trend shift from another three-week head fake.
Why the Signal Fired Now: Four Forces Hit DOGE at Once
Death crosses do not happen in a vacuum. Four forces converged on Dogecoin in the same week:
- Forced selling across crypto markets: the $1.68 billion liquidation wave hit longs hardest, and memecoins with leveraged derivatives markets are the first to cascade when margin calls start. DOGE futures open interest fell more than 5% in 24 hours to about $1.05 billion, according to CoinGlass data cited in market coverage.
- ETF money walked away: Dogecoin ETFs recorded $538,030 in net outflows during the week, including two consecutive negative sessions — $399,460 on Wednesday and $138,570 on Thursday, according to SoSoValue data. That is small money in absolute terms, but the direction matters: the institutional bid that supported DOGE earlier in the year is not showing up to catch this fall. Our earlier coverage of the Dogecoin ETF battle between Grayscale and Bitwise explains why these flows have become a key sentiment gauge.
- Weak momentum into the cross: the daily Relative Strength Index sat near 35, approaching the conventional oversold threshold of 30, while MACD remained below its signal line in negative territory. Oversold does not mean "buy now" — in a strong downtrend, RSI can sit near oversold for weeks — but it does mean the selling is stretched, which raises the odds of sharp counter-trend bounces.
- A market-wide risk-off mood: with Bitcoin down about 39% from its October 2025 all-time high near $126,080 and crypto stocks falling harder than Bitcoin itself, there was no risk appetite left to support a memecoin bounce. When Bitcoin sneezes, Dogecoin catches pneumonia — and this week Bitcoin had a very bad cold.
What Last Time Says: The November 2025 Precedent
The previous daily death cross for DOGE printed in November 2025, and it preceded months of downward price action and consolidation before stabilization took hold. That is the precedent bears will cite all week, and it is real — but it needs context.
First, the November 2025 cross arrived after a much longer topping process, not a three-week whiplash. Second, past death crosses across crypto have a mixed record: they often mark late-stage selling rather than the start of it, because a 50-day average takes weeks of weakness to fall below a 200-day average. DOGE is down from a September 22 peak near $0.105 — roughly 30% into the $0.072 low — before the cross even printed.
The fair reading: the November 2025 precedent argues against assuming a quick V-shaped recovery, but it does not argue that DOGE must fall another 30%. It argues for patience, position sizing, and waiting for levels to confirm — which brings us to the part of this article that actually matters for decisions.
5 Levels That Decide What Happens Next
Forget predictions. Watch these levels — they are where the death-cross thesis gets confirmed or invalidated, based on technical analysis cited in current market coverage:
| Level | Role | What it means if it breaks or holds |
|---|---|---|
| $0.086 | Resistance — moving-average convergence | Reclaiming this zone would put DOGE back above the daily moving averages and seriously weaken the bearish case. |
| $0.0776 | First recovery hurdle — June 6 low | DOGE lost this horizontal support in the sell-off; it is now the first ceiling a bounce must clear. |
| $0.072 | October 30 low — line in the sand | Holding above this August low keeps the decline a correction; losing it opens the next support zone. |
| $0.069 | Next support if selling persists | The first downside target cited by technical analysts if $0.072 fails. |
| $0.0676 | Annual low — the big test | A fall to this level would be roughly 10% below current prices and would mark a full retest of the year's low. |
Above the table's levels sit two more barriers: the 50-day exponential moving average near $0.0833 and the 200-day EMA near $0.0922. The gap between current prices and the 200-day EMA shows how much repair a genuine recovery requires — DOGE would need to climb more than 20% just to reach its long-term trend line.
On the downside, if $0.0676 fails, Fibonacci extension levels at $0.0598 and $0.0513 have been cited as the next supports. Nobody should treat those as forecasts — they are contingency markers for risk management, not destinations.

Three Scenarios for DOGE After the Death Cross
Bull case — the cross is a lagging washout: DOGE holds $0.072, reclaims $0.0776, and pushes through $0.086 as Binance withdrawals restart and ETF outflows reverse. The RSI bounce from near-oversold provides the fuel. Probability hinges entirely on Bitcoin stabilizing above $77,000 — DOGE does not recover alone.
Base case — months of choppy consolidation: DOGE trades between $0.069 and $0.086, with sharp bounces that fail at resistance and shallow dips that hold above the annual low. This is the November 2025 playbook: not a crash, but a grind that punishes impatience and rewards traders who wait for range edges rather than chasing breakouts.
Bear case — the cross confirms a new leg down: $0.072 fails, $0.069 gives way, and DOGE retests the $0.0676 annual low, with Fibonacci extensions at $0.0598 in play if Bitcoin breaks below $76,000. ETF outflows continue, open interest keeps shrinking, and the death cross becomes the opening chapter of a longer decline rather than its conclusion.
The base case deserves the most weight. Death crosses in choppy, post-liquidation markets most often produce grinding ranges, not straight lines — and the stretched RSI argues against assuming an immediate waterfall.
What Most People Get Wrong About the Death Cross
Myth one — "the death cross means DOGE will crash." No. It means the medium-term trend is down. Downtrends include powerful bounces, and some of the sharpest rallies in crypto history happened inside confirmed downtrends. The signal describes trend, not magnitude or timing.
Myth two — "the golden cross three weeks ago means the bulls were wrong." The golden cross was a real, mechanical event — the averages did cross. What was wrong was treating any single crossover as a trend change without confirmation. Crossovers are starting guns for analysis, not conclusions.
Myth three — "oversold means it must bounce." RSI near 35 is close to oversold, but oversold is a condition, not a trigger. Assets can stay oversold while falling further, and buying purely because an oscillator looks low is how traders catch falling knives. Wait for price confirmation — a reclaim of $0.0776 — before calling a bounce.
Myth four — "DOGE moves on its own news now." The ETF launches, the community, the merchant adoption stories — all real, all secondary this week. When $1.68 billion in leveraged positions gets liquidated market-wide, correlations go to one and DOGE trades as a leveraged Bitcoin proxy. Fundamentals matter at range extremes; in a liquidation cascade, liquidity matters more.
DOGE Holder Checklist: What to Do This Week
- Check your leverage first: if you hold DOGE on margin or in leveraged tokens, the death cross plus $1.43 billion in liquidated longs is your warning. Understand exactly where your liquidation price sits — our guide to what a crypto liquidation is and the five leverage mistakes to avoid is the essential read before adding any leveraged exposure.
- Define your invalidation level: decide in advance which level changes your mind. For bulls, a daily close below $0.069 should end the "buy the dip" thesis. For bears, a daily close above $0.086 should end the short thesis. Write it down before the market moves.
- Watch Bitcoin, not just DOGE: DOGE's fate this week is tied to whether Bitcoin holds $76,000–$77,000 and whether Monday's ETF flows reverse Friday's $643 million outflow. If Bitcoin breaks down, DOGE's levels will not hold on their own.
- Watch the Binance restart: Binance has said withdrawals should resume in phases, with proof-of-reserves results due by November 2. A smooth restart removes an overhang; another delay extends the risk-off mood.
- Do not chase the first green day: post-liquidation bounces are violent and often fail at the first resistance ($0.0776). Let the bounce prove itself with a close above that level before adding.
- Separate trading from holding: if you are a long-term holder, a death cross is noise unless your thesis changed. If you are a trader, it is a regime signal that should shrink your size and tighten your stops. Confusing the two is how holders panic-sell bottoms and traders marry losing positions.
Dogecoin vs the Rest: Why DOGE Fell Harder Than Bitcoin
It is worth asking why Dogecoin's chart produced this signal while Bitcoin, for all its own weakness, did not print an equivalent cross this week. The answer is structure. DOGE's September peak near $0.105 was followed by a steady bleed, so its 50-day average had been falling for weeks before the Binance shock. Bitcoin's decline, while steep, came from a higher base with stronger institutional support. DOGE also carries a thinner order book and a larger leveraged-derivatives footprint relative to its market cap, so liquidation cascades hit it disproportionately.
The comparison with other memecoins is instructive too. If you are weighing DOGE against its rivals in this environment, our Dogecoin vs Shiba Inu comparison for 2026 lays out the investment case for each — and the same risk-off logic applies to both. And if you are new to crypto entirely, start with our best crypto for beginners guide before putting money into a memecoin in a confirmed downtrend.
FAQs
What is a death cross in crypto?
A death cross is a technical pattern where a short-term moving average — usually the 50-day — crosses below a long-term moving average, usually the 200-day. It signals that the medium-term trend has weakened relative to the long-term trend and is widely watched by trend-following traders. It is a lagging indicator: it confirms weakness that has already happened rather than predicting a specific future move.
When did Dogecoin's death cross happen?
Dogecoin's first daily death cross of 2026 completed on October 30, 2026, when the 50-day SMA fell below the 200-day SMA. The previous daily death cross occurred in November 2025 and was followed by months of downward price action. Remarkably, a golden cross had formed just three weeks earlier, on October 5, 2026 — the shortest golden-to-death-cross flip in DOGE's history, according to community analysis.
What price is Dogecoin now?
DOGE fell to $0.072 on October 30, 2026, its lowest since August 2026, and was trading around $0.075 shortly after. The token had rallied to $0.081 on October 29 before the sell-off, and its market capitalization stood near $11.7 billion.
Will Dogecoin fall to $0.0676?
That is the annual low and the key downside test if $0.072 and $0.069 both fail — roughly 10% below current prices. It is a scenario, not a forecast. A fall there would likely require Bitcoin to break below $76,000 and ETF outflows to continue. Conversely, a daily close back above $0.086 would seriously weaken the bearish case.
Is a death cross a good time to buy Dogecoin?
Not on its own. Death crosses are lagging signals and often arrive after much of a decline has already happened, which means they can mark late-stage selling — but they can also precede further declines, as in November 2025. The disciplined approach is to wait for price confirmation: a reclaim of $0.0776, then $0.086, with improving momentum. Buying purely because an indicator looks oversold is a common and expensive mistake.
What should DOGE holders watch next week?
Five things: whether $0.072 holds, whether Monday's Bitcoin ETF flows reverse Friday's $643 million outflow, whether Binance restarts withdrawals smoothly with proof-of-reserves results due by November 2, whether DOGE ETF outflows stop, and whether the U.S. midterm elections on November 3 shift risk appetite. Any one of these can override the chart — together, they decide whether the death cross becomes a footnote or a chapter.
Conclusion
Dogecoin's first death cross of 2026 is a real signal, but its real story is the whiplash: a golden cross on October 5, a death cross on October 30, and a $0.072 low in between, all inside a $1.68 billion liquidation cascade triggered by the largest exchange hack in crypto history. The pattern tells you the trend is down. It does not tell you how far down, or for how long — that is what the five levels are for.
Watch $0.086 above and $0.069 below. A close above the first kills the bearish case; a close below the second confirms it. Everything between is noise, and in a market that just flipped from golden cross to death cross in three weeks, noise is the most expensive thing you can trade on.
Sources: U.Today, HokaNews, Coinotag, FXStreet, CryptoWisser, CoinGlass liquidation data, SoSoValue ETF flow data. Price levels cited are technical reference points from market coverage, not financial advice. This article is for information only.