Bitcoin Rainbow Chart Explained: What the Rainbow Bands Say About BTC at $81,500 (2026 Guide)
Bitcoin's rainbow chart says $81,500 is a 'fire sale' — but the model's bands keep widening. Here's how the famous chart works, what band BTC is in right now, and what it has (and hasn't) predicted.

Bitcoin is trading near $81,500, fighting to hold the $80,000 line for the fourth time this month. Sentiment has flipped from greed to neutral in a single day, spot Bitcoin ETFs just posted a $635 million one-day outflow, and the Federal Reserve's October 27–28 meeting looms over every risk asset on the planet.
And yet one of crypto's most famous charts is flashing a message that sounds almost absurd in this climate: fire sale.
The Bitcoin rainbow chart — the colorful logarithmic curve that has guided (and misled) generations of Bitcoin holders — currently places BTC below even its lowest band. On the Coinglass version of the model, the blue "Fire Sale!" zone sits near $111,500 for early November 2026, which means today's price is not just cheap by the model's standards — it is off the bottom of the chart entirely.
So which is it: generational buying opportunity, or a broken model? This guide explains how the rainbow chart actually works, where Bitcoin sits on it right now, what it has correctly called over 12 years of history, where it has failed — and how to use it without getting burned. If you are new to Bitcoin itself, start with our complete beginner's guide to how BTC works before diving into the charts.
What Is the Bitcoin Rainbow Chart?
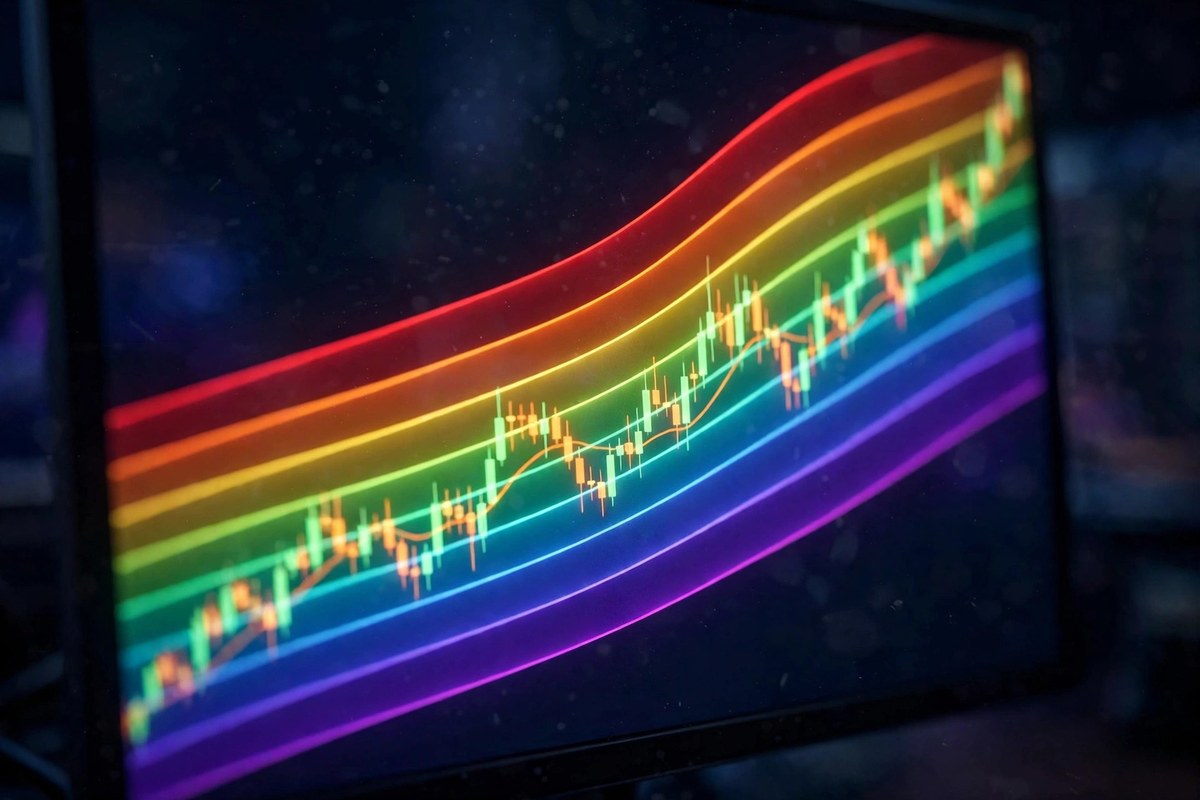
The Bitcoin rainbow chart is a long-term valuation tool that plots Bitcoin's price on a logarithmic scale against time, overlaid with colored bands that run from deep blue at the bottom to deep red at the top. Each band carries a blunt, meme-flavored label telling you what the model thinks of the current price: "Fire Sale!" at the bottom, "Maximum Bubble Territory" at the top.
Its origin story is one of crypto's best. In 2014, during the brutal bear market that followed the Mt. Gox collapse, a Reddit user named azop posted a hand-drawn rainbow chart on r/Bitcoin as a joke — a bit of morale-boosting hopium for shell-shocked holders. A Bitcointalk forum member known as Trolololo (also called Holger) later gave the joke mathematical bones by fitting the bands to a logarithmic regression of Bitcoin's price history. Blockchain Center began hosting the interactive version, and it became the most-shared chart in all of crypto. A detailed history of the chart's journey from meme to indicator traces how each revision changed its meaning.
The bands you will see on the classic (V1) chart, from bottom to top, are:
- Dark blue "Fire Sale!": extreme undervaluation — historically the best long-term buying zone
- Blue "BUY!": deep value — where cycle bottoms have typically formed
- Teal "Accumulate": below fair value — steady buying conditions
- Green "Still Cheap": modestly below fair value
- Light green "HODL!": near fair value — the long-term trend zone
- Yellow "Is this a Bubble?": above fair value — time for caution
- Orange "FOMO intensifies": significantly above fair value — late-cycle territory
- Red-orange "Sell. Seriously, SELL!": historically rare — cycle tops live here
- Red "Maximum Bubble Territory": extreme overheating — the blow-off top zone
The original V1 chart actually had ten bands, with a purple "Bitcoin is dead" strip at the very bottom. The updated Coinglass version trims the model to nine bands and drops the purple floor, leaving "Fire Sale!" as the lowest zone. Bitbo's halving-price-regression version (V2), revised in November 2022 with additional history, recalibrates the curve to fit 2024–2026 price behavior more closely. This matters: two screenshots can carry the same name while using different curves, so always check which version and date you are looking at. Blockchain Center itself warns that the chart is a way to view historical prices — not a tool for predicting them. The logarithmic scale behind the bands is what gives the chart its shape, and understanding it is key to not being fooled by it.
Where Bitcoin Sits on the Rainbow Chart Right Now
Here is the striking part. With Bitcoin near $81,500 on October 23, 2026, the price is sitting below the lowest band of the current rainbow models — the zone that does not officially exist.
On the Coinglass version, the blue "Fire Sale!" band stands around $111,500 for early November 2026, with the "BUY!" level near $151,600, "Accumulate" near $208,000, and "Maximum Bubble Territory" above $1.3 million. Bitcoin at $81,500 is roughly $30,000 under the fire-sale line. The Bitbo halving-regression model — which you can check live here — tells the same story in different numbers: its fair-value trend line sits near $131,700 today, putting the current price about 38% below trend — and its band reading is simply "Below Low."
How unusual is that? Very. According to Bitbo's historical band distribution, Bitcoin has spent only about 11% of its entire history below the lowest band. In 2026, however, it has spent roughly 91% of days there — the model keeps projecting higher while the market refuses to follow. The previous comparable episode was the 2022 bear market, when BTC spent about 35% of the year below the low band near the $15,770 cycle bottom.
For context, Bitcoin remains about 34% below its all-time high of $126,038, yet it is up roughly 30% since the April 2024 halving and up more than 400% from the November 2022 low. Zoom out far enough and the rainbow chart's core claim — that Bitcoin's long-term trajectory bends upward on a log scale — is still intact. Zoom in to 2026 and the chart looks like it is shouting into the wind.
What the Rainbow Chart Has Gotten Right — and Wrong
To judge the rainbow chart fairly, you have to separate its two jobs: describing where price is relative to history (which it does well) from predicting where price goes next (which it was never designed to do).
What it got right. The warm red bands have marked every major cycle top: late 2013, December 2017, and the 2021 double top all pushed into "Sell. Seriously, SELL!" and "Maximum Bubble Territory." The cool blue bands have marked the generational bottoms: the 2015 bear-market low, the December 2018 capitulation, and the November 2022 low near $15,770 all printed in "BUY!" or below. Anyone who bought blue and sold red across those cycles did extraordinarily well — which is exactly why the chart earned its cult following.
What it got wrong. The bands widen relentlessly over time, because a log-regression curve fitted to history keeps projecting higher while actual adoption growth slows. That means "below the lowest band" readings can persist for months or years without a snap-back — 2022 proved it, and 2026 is proving it again. The model also has no concept of macroeconomics: it cannot see interest rates, ETF flows, or wars. And its top bands have become almost unreachable: "Maximum Bubble Territory" above $1.3 million is not a forecast, it is a curve-fit artifact. Critics argue the model may be breaking in real time, noting that stock-to-flow — the rainbow chart's more famous cousin — already crossed from useful to broken, and asking whether the rainbow is heading the same way.
The honest verdict: the rainbow chart is a superb valuation compass and a terrible timing tool. Blue zones have always been good places to accumulate; they have never told you the exact week to buy. If you want to sharpen your chart-reading beyond a single indicator, our beginner's guide to crypto technical analysis walks through the tools professionals actually combine.
Why the Model Says "Fire Sale" While the Market Is Afraid
The gap between the rainbow chart's optimism and the market's anxiety is really a gap between two timeframes. The model looks at 16 years of log-scale history; the market looks at the next Fed meeting.
And the market has plenty to fear right now. On October 22, Bitcoin fell roughly 3–4% toward $81,000 as the Nasdaq posted its worst session since June, down 2.6% on doubts about how the AI buildout will be financed — the Nexo research desk's daily market note puts BTC near $81,700 with a Fed hold nearly fully priced for next week. President Trump's statement that Washington is not negotiating with Iran added a geopolitical risk premium, Brent crude pushed toward $111–114 a barrel, and U.S. spot Bitcoin ETFs recorded a $635.6 million single-day net outflow — one of the largest of the year, with BlackRock's IBIT alone shedding about $254 million.
Context softens that outflow number considerably. The same ETFs had absorbed more than $1 billion in the first three sessions of the week, leaving the week's net inflow at roughly $442 million — the money is tactical, rotating in and out, not fleeing. Roughly $440–470 million in leveraged crypto positions were liquidated in the same selloff, almost entirely longs, which is the market's standard way of resetting before its next move. The Crypto Fear and Greed Index slid from 68 to 50 in a single day — greed to neutral overnight. For a deeper dive into the day's drivers, see our breakdown of why crypto fell today and our analysis of the record ETF outflow.
Meanwhile the $80,000–$81,500 zone has become the most contested ground in crypto. It is roughly where U.S. spot Bitcoin ETFs and corporate treasuries are estimated to have their average cost basis, and it has now absorbed major selloffs on October 8, 13, and 15 — each flush liquidating hundreds of millions in leveraged longs before buyers stepped back in. Four tests in fifteen days is a lot; as analysts note, each defense thins the bids for the next one. Whether you read that as resilience or exhaustion depends entirely on your timeframe — which is precisely the rainbow chart's point.
What Traders Are Watching Instead of the Rainbow
Professional desks are not trading off rainbow colors this week. Their dashboard looks like this:
- The October 27–28 FOMC meeting: a hold is priced at nearly 92%, so the real event is what the Fed signals about December. Seven of the last eight FOMC meetings in 2025 were followed by Bitcoin declines — dovish surprises are the bull case. Cointelegraph's market coverage tracks how each macro headline has moved BTC this week.
- The $81,300–$84,400 range: Bitfinex analysts see Bitcoin trapped here until the Fed decision, with a daily close below $81,300 exposing lower supports and a break above $84,400 opening the path toward $87,500.
- ETF flow direction: after the $635 million outflow day — broken down fund by fund here — the question is whether institutional buying resumes or the week ends in the red. Our Bitcoin $100K prediction-market analysis tracks how traders are pricing the bigger targets.
- Open interest and leverage: futures open interest hit its highest level since late September just before the reversal — elevated leverage is what turns ordinary dips into liquidation cascades. Our open interest explainer covers why this metric matters.
- The Bitfinex warning: their desk argues $81,300 has become the new ceiling and $80,000 the line in the sand — read the full breakdown here.
None of these contradict the rainbow chart; they operate on a different clock. The rainbow chart answers "is Bitcoin cheap relative to its 16-year trend?" The trading desk answers "what happens before Halloween?" Both can be right at once.

How to Use the Rainbow Chart Without Getting Burned
If you want the rainbow chart in your toolkit, use it the way its history suggests — as a sentiment anchor, not a signal generator:
First, treat bands as zones, not triggers. "Fire Sale!" does not mean buy everything today; it means the long-term odds favor accumulation over distribution. The 2022 bottom spent months below the lowest band before turning. Patience is the entire strategy.
Second, pair it with a buying method, not a feeling. The investors who benefited most from blue zones were not timers — they were accumulators. Dollar-cost averaging into Bitcoin through fear zones is the practical implementation of what the rainbow chart preaches. Our guide to the best time to buy Bitcoin layers historical seasonality on top.
Third, cross-check with sentiment tools built for the short term. The rainbow chart will not tell you the market is panicking; the Crypto Fear and Greed Index will — and buying when it reads extreme fear has historically paired well with blue rainbow zones.
Fourth, know which version you are looking at. V1 (Blockchain Center, ten bands), Coinglass (nine bands), Bitbo V2 (recalibrated 2022) — the band boundaries differ, and the "current band" you quote should always name its source. A screenshot without a date and version is just a pretty picture.
Fifth, remember what the publisher says. Blockchain Center explicitly warns against using the chart to predict Bitcoin's price. When the people maintaining the model tell you it is not a crystal ball, believe them. For the bigger question of whether Bitcoin belongs in your portfolio at all, our honest 2026 investment guide weighs the risks and returns without the hype.
Bitcoin Rainbow Chart FAQs
- Which band is Bitcoin in on the rainbow chart right now?
With BTC near $81,500 in late October 2026, the price sits below the lowest band on current models — under the blue "Fire Sale!" zone (around $111,500 on the Coinglass version) and below the low band on Bitbo's halving-regression version, which reads about 38% below its fair-value trend. - Is the Bitcoin rainbow chart accurate?
It has an excellent record as a long-term valuation gauge: cycle tops landed in the red bands and cycle bottoms in the blue bands in 2013–2015, 2017–2018, and 2021–2022. It is a poor timing tool — below-band readings can persist for many months — and its far-future bands are curve-fit artifacts, not forecasts. - Who created the Bitcoin rainbow chart?
Reddit user azop posted the original as a joke in 2014; Bitcointalk member Trolololo added the logarithmic regression; Blockchain Center popularized the interactive version; Bitbo released a recalibrated V2 in November 2022. - What is the difference between V1 and V2 of the rainbow chart?
V1 (Blockchain Center) is the original ten-band model with a purple "Bitcoin is dead" floor. V2-style versions (Bitbo's halving price regression, Coinglass's nine-band chart) recalibrate the curve with more recent data and adjust the bands — Coinglass drops the purple band entirely, making "Fire Sale!" the lowest zone. - Can Bitcoin go below the lowest rainbow band?
Yes — and it has. BTC spent about 35% of 2022 below the low band and roughly 91% of 2026 there so far. The bands describe a statistical trend, not a floor; macro shocks, leverage flushes, and slowing adoption growth can all push price under them for extended periods. - Does the rainbow chart predict Bitcoin will reach $1 million?
No. The upper bands (including "Maximum Bubble Territory" above $1.3 million on current projections) are extrapolations of a log curve, not predictions. The chart's publisher explicitly warns against using it to forecast prices.
The Bottom Line
The Bitcoin rainbow chart is telling a remarkable story right now: at $81,500, BTC is priced below even the "Fire Sale!" band — a valuation reading the model has produced only a handful of times in 16 years. Every previous visit to the cool-blue depths eventually rewarded patient accumulators, from 2015 to 2018 to 2022.
But the chart's own history carries the warning label. Below-band readings can last for months. The model cannot see the Fed meeting on October 27–28, the $635 million ETF outflow, or the AI-stock selloff dragging every risk asset down with it. It is a compass, not a crystal ball — best used to anchor your emotions while a disciplined strategy like dollar-cost averaging does the actual work.
So is $81,500 Bitcoin a fire sale? By the rainbow chart's 16-year yardstick: yes, emphatically. By the market's four-day yardstick: ask again after the Fed speaks. The investors who have won with this chart were never the ones who needed both answers to agree — they were the ones who bought the blue zones and waited.