Bitcoin Fell After All 7 Post-Pause Fed Hikes Since 2016 — Median Drop 2.4%, Worst 42% — December 9 Is Next
Bitcoin has fallen after every single post-pause Fed hike since 2016 — 7 for 7, median drop 2.4%, worst 42%. With BTC at $74,800 and a December 9 hike priced at roughly 67–80%, here is what history says happens next.
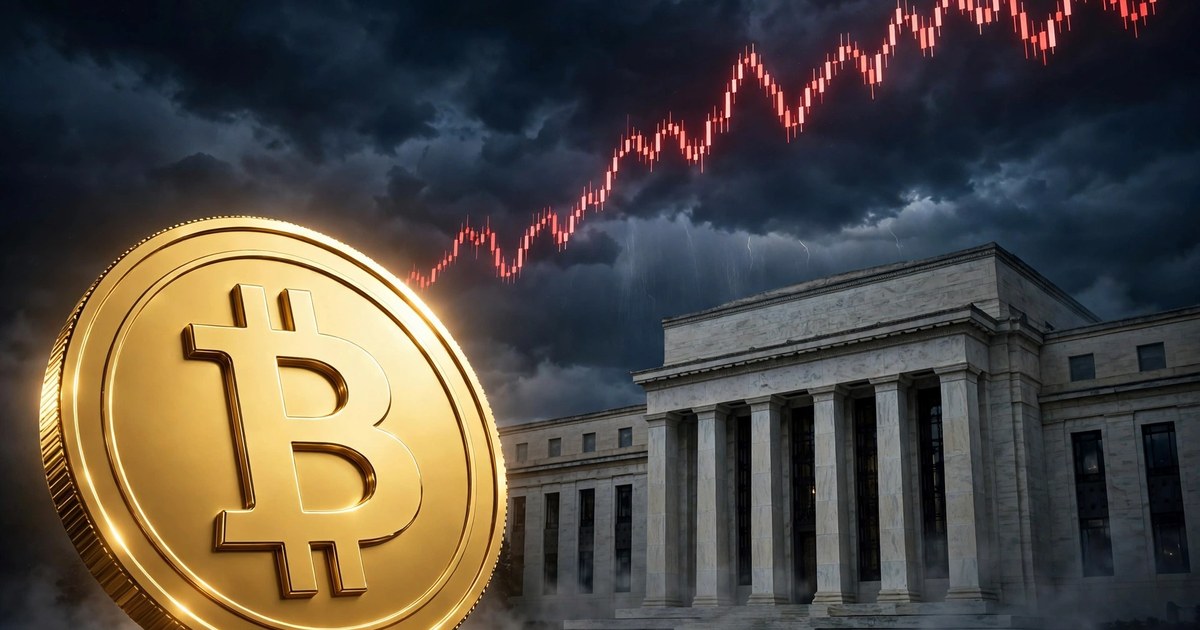
Bitcoin Is 7 for 7 — and December 9 Is Next
Bitcoin has fallen after every single Federal Reserve rate hike that followed a one-meeting pause since 2016. Seven hikes, seven declines, a median drop of 2.4% in the 30 days after the move — and the worst case, in 2018, was a 42% slide. That is the finding of a new Crypto Briefing study published on November 6, and it lands at the worst possible moment for Bitcoin holders: BTC is trading at roughly $74,800 on Monday, November 9, after sinking to $73,708 on Sunday evening — its lowest price since August — and the Federal Reserve meets on December 8–9 with markets pricing a roughly 67% to 80% chance of exactly the kind of hike the study warns about.
This is not a prediction. Seven observations is a small sample, and the study's authors say so themselves. But a 7-for-7 record forces a serious question: if the Fed hikes on December 9, is Bitcoin's next leg down already written — or is this the cycle where the pattern finally breaks?
What Happened This Weekend: Bitcoin's Fifth Losing Week in a Row
Bitcoin closed its fifth consecutive losing week. The week of November 2–8 opened at $78,232 and closed at $74,754, a loss of 4.45%, according to CryptoCompass. On Sunday evening, BTC fell within an hour from just over $75,600 to $73,477, and KuCoin's daily market report puts the intraday low at $73,510. Ether fared worse, touching $2,060 and trading near $2,140 after breaking below the $2,200–$2,230 zone.
The selling has several drivers stacking up at once. US spot Bitcoin ETFs recorded approximately $412 million in outflows on Friday alone, taking weekly withdrawals to nearly $1.3 billion, per the CoinSwitch Markets Desk. Stronger-than-expected US jobs data — 165,000 new jobs in October against expectations of just 65,000 — has sharpened fears of a December rate hike. The Democratic sweep of Congress in the November 3 midterms has traders pricing in a harder road for crypto-friendly legislation, and the market is still digesting the reported $6.3 billion theft from Binance, the largest crypto theft on record. The Crypto Fear & Greed Index sits at 29, firmly in "Fear" territory.
Against that backdrop, the level every trader is watching is the 200-day moving average at around $73,170. Bitcoin has not closed decisively below it — yet. Lose it, and the correction that began in early October starts to look like a downtrend. The next test comes fast: US consumer-price data for October is published on Tuesday, November 10.
The Study: 7 Hikes, 7 Falls, One Median Number
Crypto Briefing's research, reported on November 6, looked at every Federal Reserve rate hike since 2016 that immediately followed a one-meeting pause — the exact sequence the Fed is in right now. The Fed raised its policy rate by a quarter point on September 16, to 3.75% to 4.00%, then held rates at its October 28 meeting in a 10–2 vote. A move on December 9 would complete the same hike–pause–hike sequence for the eighth time.
Across the seven historical 30-day windows after those hikes, Bitcoin finished lower every single time. The median decline was 2.4%. Stocks did not show the same consistency — equities were split over the same post-hike windows, which is what makes the crypto side of the result stand out.
The study's most dramatic data point is 2018. That year, the same calendar produced a 42% drop in Bitcoin between the midterm election and the December hike. It is the extreme case, not the typical one — the median across all seven windows is a much milder 2.4% — but it is also the case that looks most like today: a midterm election that changed the balance of power in Washington, followed by a December hike. In 2026, that window has already taken Bitcoin from above $80,000 to below $75,000 before the hike has even happened.
Two caveats matter, and the study states both plainly. First, the sample is seven hikes — enough to notice, not enough to prove. Second, the research does not present the pattern as a forecast. A 7-for-7 record tells you what has happened, not what must happen. The full report sits behind Crypto Briefing Pro, so the individual returns for each of the seven windows are not public — only the headline numbers: 7 for 7, median −2.4%, worst case −42%.
Why a Fed Hike Hits Bitcoin Harder Than Stocks
Three channels explain the pattern, and all three point the same way right now.
First, the discount rate. Bitcoin produces no cash flow — no dividends, no interest, no earnings. Its value is the present value of what people believe it will be worth in the future, discounted back at the prevailing interest rate. When the Fed raises rates, the discount rate rises and the present value of every future dollar falls. Stocks have earnings to cushion that maths; Bitcoin does not.
Second, real yields. A hike raises the yield on safe government bonds, which makes holding a non-yielding asset more expensive in opportunity-cost terms. The ten-year inflation-protected yield stood at 2.63% on October 29, and every quarter point the Fed adds makes the "why hold Bitcoin instead of Treasuries?" question harder to answer. This is the same mechanism that has driven $1.3 billion of ETF outflows in a week: when safe yield rises, the flows reverse first.
Third, dollar funding. Crypto trades are heavily leveraged, and leverage is priced in dollars. A rate hike makes dollar funding more expensive, which forces leveraged positions to close — and forced selling is what turns a dip into a rout. Bitcoin exchanges recorded net outflows of approximately 4,655 BTC on November 7, while Ethereum saw net inflows of around 29,820 ETH over seven days. The 14-day Relative Strength Index for Bitcoin stands at 36.65 — close to oversold, but not there yet — and trading volume has run at 1.29 times its 30-day average, suggesting conviction behind the recent moves.
December 9: Three Scenarios for Bitcoin
The Federal Open Market Committee meets for the last time this year on December 8–9. The odds of a quarter-point hike have bounced around by source and date: Polymarket and CME FedWatch put them at about 67% as of November 5, while futures markets priced in around 80% after the hot October jobs report. Whichever number you use, a hike is the base case, not a tail risk. Here is what each outcome could mean for Bitcoin, using the price levels the market itself has drawn this week.
| Scenario | Trigger | Bitcoin levels to watch | What history says |
|---|---|---|---|
| Bull — hike priced in, dovish message | Fed hikes 25bp but signals a long pause; CPI comes in cool on Nov 10 | Reclaim $76,000, then $78,000; $80,000 back in play | Breaks the 7-for-7 pattern; the "priced in" argument finally wins |
| Base — hike, median outcome | Fed hikes 25bp on Dec 9 with a neutral statement | BTC drifts to $73,170 (200-day average), then ~$73,000 — a 2.4% slide from $74,800 | Matches the study's median: 2.4% lower 30 days after the hike |
| Bear — hike plus hawkish surprise | Hot CPI, hawkish dot plot, or a 50bp signal; ETF outflows accelerate | Lose $73,170, then $71,000; a 10–12% pullback points to $65,000–$67,000, the long-term institutional base | Echoes 2018's 42% midterm-to-December slide; the pattern's worst case |
The base case is deliberately boring: a 2.4% decline from $74,800 puts Bitcoin at roughly $73,000 thirty days after December 9 — almost exactly on the 200-day moving average. It does not predict a crash; it predicts a grind lower, with the 200-day line as the battleground. The bear case is the one that matters for risk management: analysts cited by Mitrade note that if BTC completely loses $75,000, technical factors could trigger a secondary pullback of around 10% to 12%, pointing toward $65,000 to $67,000 — a range that served as a strong long-term institutional base before the first-quarter rally.
For readers weighing whether to buy, hold or wait, our evergreen guides are the place to start: Is Bitcoin a Good Investment in 2026? covers the risks, returns and sensible allocation sizes, How to Invest in Bitcoin in 2026 lays out a five-step plan for first-time buyers, and What Is a Bitcoin ETF? explains the spot ETF mechanics behind the $1.3 billion of weekly outflows. If you already hold, How to Store Bitcoin Safely in 2026 covers the seven steps that keep coins off vulnerable exchanges — relevant in a week when the Binance theft is still fresh.
What Could Break the Pattern This Time
A 7-for-7 record is striking, but patterns break, and there are three genuine reasons this December could be different.
The hike is unusually well-telegraphed. In past cycles, part of the post-hike decline was surprise. This time, markets have priced a December hike at 67% to 85% for weeks. If everyone already expects the hike, the selling may already be done — Bitcoin has already fallen from above $80,000 to $74,800 before the meeting. The study measures 30 days after the hike; it does not measure the weeks before it, when much of the move may already have happened.
The macro backdrop is different. The Fed hiked in September for the first time since 2023, and the October pause was a genuine split — two dissenters wanted to hike immediately. But third-quarter GDP grew at an annualised 3.4%, up from 2.2%, and the labour market added 165,000 jobs. A hike into a strong economy is not the same as a hike into a slowdown.
The sample is seven. One December where Bitcoin rises after a hike would turn 7-for-7 into 7-for-8, and the pattern would look far less inevitable. The study's authors do not claim otherwise. That said, the counter-argument to the counter-arguments is the calendar. The 2018 precedent is the one that rhymes most: a midterm election, a December hike, and a 42% slide in between. The 2026 version of that calendar is already half-written — the midterms happened on November 3, Bitcoin has already fallen more than 6% since, and the hike is a month away.

What Most People Get Wrong About Fed Hikes and Bitcoin
"A hike is already priced in, so it can't hurt." Pricing in is not the same as immunity. Markets priced in the September hike too, and Bitcoin still fell after it. What gets priced in is the hike itself; what moves markets afterwards is the statement, the dot plot and the press conference. A hike with a hawkish message is a different event from a hike with a dovish one.
"Bitcoin is digital gold, so it should rise when the Fed tightens." Gold and Bitcoin have behaved very differently this year. Gold has held near $4,100 while Bitcoin sits 40% below its peak, and our earlier comparison — Bitcoin vs Gold in 2026 — explains why: gold has central-bank buyers and no leverage, while Bitcoin's price is set at the margin by leveraged traders and ETF flows.
"Seven out of seven means a crash is certain." No. The median outcome in the study is a 2.4% decline — a normal bad month, not a crash. The 42% figure is one extreme observation from 2018, not a forecast. Treating the worst case as the base case is as much of an error as ignoring the pattern entirely. The honest reading is: the odds favour a lower Bitcoin 30 days after December 9, the typical damage is small, and the tail risk is large.
What to Watch Before December 9: The Dated Checklist
The pattern gives you a hypothesis; the calendar gives you the tests. Five dated events between now and the FOMC decision will decide which scenario plays out.
- Tuesday, November 10 — October CPI (2:30 p.m. CET). The single most important release before the Fed meeting. A cool reading revives hopes the Fed stands pat; a hot reading locks in the hike. Our earlier CPI preview — CPI November 10: Bitcoin at $75,700 — 3 Numbers That Decide $68,000 or $80,000 — maps the levels.
- Friday, November 13 — October PPI. Producer prices ran hot at 6.3% year over year. If PPI confirms the inflation pressure, the Fed's hawkish camp gains strength.
- Tuesday, November 17 — October retail sales. Strong sales support the "hike into strength" story; weak sales give the doves an argument that the economy is cooling.
- Tuesday, November 25 — October personal income and outlays. The last major demand data before the blackout period, and the Fed's preferred window into consumer health.
- Friday, December 4 — November jobs report. Lands inside the Fed's blackout period, so officials cannot comment on it — but markets can, and a second hot jobs print would cement the hike.
- December 8–9 — FOMC decision. The hike itself, the dot plot, and the press conference. Watch the statement's language on future moves more than the 25 basis points everyone already expects. Our odds tracker — Fed December Rate Hike Odds Hit 79%: Bitcoin at $75,700 — will be updated as the meeting approaches.
- The $73,170 line, every day. The 200-day moving average is the technical tripwire. A daily close below it turns the base case into the bear case; a reclaim of $76,000 turns it into the bull case.
What This Means for Your Bitcoin
If you hold Bitcoin, the study is a risk-management input, not a sell signal. A median 2.4% decline is the kind of move a long-term holder absorbs without blinking; a 10–12% slide to $65,000–$67,000 is the kind of move that tests conviction. Know your levels ($73,170 below, $76,000 above), know the dates (CPI Tuesday, FOMC December 9), and do not confuse a well-sourced historical pattern with a guarantee.
If you are thinking of buying the dip, the pattern argues for patience or staging rather than going all-in at $74,800. Bitcoin has fallen after every post-pause hike since 2016, and the hike has not happened yet. Dollar-cost averaging through the December 9 decision is the approach that survives both the median outcome and the tail risk.
If you trade short-term, the levels are unusually clean: support at $74,740, then the 200-day average at $73,170; resistance at $75,590, then $76,000. A break of either side in the run-up to CPI will set the direction into December. Volume at 1.29 times its 30-day average says the market means its current moves. None of this is investment advice — the levels in this article reflect reports dated November 9, 2026, and a single CPI print on Tuesday could make them stale within hours.
FAQs
What did the Crypto Briefing study actually find?
Bitcoin finished lower 30 days after all seven Federal Reserve rate hikes since 2016 that immediately followed a one-meeting pause. The median decline was 2.4%. Stocks were split over the same windows, so the pattern is specific to Bitcoin. The study does not present it as a forecast, and the full report is behind Crypto Briefing Pro.
When is the next Fed decision, and what are the odds of a hike?
The Federal Open Market Committee meets on December 8–9, 2026. Polymarket and CME FedWatch put the odds of a quarter-point hike at about 67% as of November 5, while futures markets priced in around 80% after the hot October jobs report. The Fed hiked 25 basis points on September 16 (to 3.75%–4.00%) and held rates on October 28 in a 10–2 vote.
What happened in 2018, the worst case in the study?
In 2018, the same calendar — a midterm election followed by a December Fed hike — produced a 42% drop in Bitcoin between the election and the hike. It is the extreme observation, not the typical one: the median across all seven windows is a 2.4% decline. The 2018 case matters because 2026 shares its shape, but it is one data point, not a prediction.
Why does a Fed hike hurt Bitcoin more than stocks?
Bitcoin has no cash flows, so a higher discount rate hits its present value harder than it hits dividend- or earnings-paying stocks. Higher rates also raise the yield on safe government bonds, increasing the opportunity cost of holding a non-yielding asset, and make dollar funding more expensive for leveraged traders. That combination is why Bitcoin fell after all seven post-pause hikes while stocks were split.
What price levels matter before December 9?
Support sits at $74,740, then the 200-day moving average at about $73,170 — a daily close below it would signal the correction is becoming a downtrend. Resistance is at $75,590, then $76,000; reclaiming $76,000 would open a recovery toward $78,000. A 10–12% pullback points to $65,000–$67,000, the long-term institutional base from before the first-quarter rally.
Is the 7-for-7 pattern a reason to sell Bitcoin?
Not on its own. The median outcome is a 2.4% decline — a normal bad month — and seven observations is a small sample. Use the pattern as a risk-management input: know the levels, watch the dated events (CPI on November 10, PPI on November 13, the jobs report on December 4, the FOMC decision on December 8–9), and consider staging entries rather than going all-in before the decision. This article is not investment advice.
Conclusion
Seven hikes, seven declines, a median drop of 2.4% and a worst case of 42%. That is the record Bitcoin carries into the December 9 Fed meeting — more striking than the $73,708 Sunday low, the $1.3 billion of weekly ETF outflows, or the Fear & Greed reading of 29. Bitcoin is trading at $74,800 with its 200-day moving average at $73,170 directly below it and a CPI print on Tuesday that could sharpen or soften the hike case.
The pattern will either hold for an eighth time or break, and December 9 will tell us which. Until then, the disciplined move is the boring one: watch the $73,170 line, watch the CPI print on Tuesday, and remember that the study's median outcome is a 2.4% slide — survivable — while its worst case is a 42% rout.