Bitcoin CPI Report November 10: BTC at $74,500 Faces a 0.2% Number That Decides $70,000 or $80,000
October CPI lands Tuesday at 8:30 a.m. ET — and the headline annual inflation number won't even exist. With Bitcoin at $74,500, below its 50-week average, and an 81% chance of a December Fed hike priced in, one-tenth of a percent on core CPI decides whether BTC holds $74,000 or breaks toward $70,000.

Tomorrow at 8:30 a.m. ET, a single number decides whether Bitcoin holds $74,000 or breaks toward $70,000 — and the inflation figure everyone usually quotes won't even exist. October's CPI report lands on Tuesday, November 10, with no year-over-year rate at all, a December Fed rate hike priced at roughly 81%, and Bitcoin sitting below its 50-week moving average for the first time in weeks. This is the most important 60 seconds of the month for crypto holders.
Bitcoin traded near $74,500 on Monday, November 9, after falling as low as $73,708 on Sunday night, according to Reuters. Ethereum slipped to about $2,130, XRP fell nearly 6% to $1.10, and Solana dropped to roughly $87. The total crypto market is worth about $2.565 trillion — 38.5% below its $4.28 trillion peak of October 7, 2025. Google searches for "Bitcoin to Zero" spiked 450% in 24 hours, passing 1.5 million searches. What happens next depends almost entirely on one line of Tuesday's report: core CPI, month over month.
Bitcoin Is Already on the Ropes Before CPI Arrives
Bitcoin did not drift to $74,500. It was pushed there. The newest leg of selling started on October 29, when Binance was hacked for about $6.3 billion in the largest exchange theft on record. Then the Federal Reserve held rates on October 28 with two officials voting for another hike, US spot Bitcoin ETFs lost about $1.16 billion over the three trading days from October 30 to November 3, and the US midterm elections delivered a Democratic sweep that the market read as bad news for the CLARITY Act. The full timeline of the 2026 crash shows how these shocks stacked up through the year.
The whipsaw that followed tells you everything about the leverage in this market. Bitcoin dipped to about $75,618 as midterm results came in on November 4, then ripped to $81,105 within hours, wiping out more than $560 million in short positions. By the next morning it had bled back toward $77,000, and on Thursday, November 5, it fell to an intraday low of $75,468 on Bitstamp as the Nasdaq dropped 5.5% in a sharp tech-stock selloff. More than $1 billion in crypto positions were liquidated in 24 hours, with longs absorbing nearly 90% of the forced closures, according to CoinGlass figures. US spot Bitcoin ETFs saw another $430.2 million in net outflows on November 5 alone.
Technically, the damage is real. Bitcoin has fallen below its 50-week moving average of $75,733. The next support sits at the 200-day moving average near $73,200, and below that, the market starts talking about $70,000. On the upside, the first resistance band is $80,000 to $81,105, the post-midterm peak. Bitcoin is now roughly 40% below its all-time high of about $126,200, set on October 6, 2025. The Crypto Fear and Greed Index read 34 (Fear) on November 4, after touching 26 a day earlier — its lowest reading since August 6.
The altcoin damage is worse, which matters because it shows this is a risk-off move, not a Bitcoin-specific one. XRP fell 5.9% in a single day to $1.10, with futures open interest collapsing 12.07% as traders closed positions into the decline. Ethereum dropped 4.7% to about $2,130, Solana lost 2.8% to roughly $87, and Dogecoin slid to $0.069 — down 61.7% over the past year. When everything falls together and leveraged longs are the ones being liquidated, the market is waiting for a macro catalyst. That catalyst arrives Tuesday morning.
The CPI Report That Has No Annual Number
Here is the twist that makes this CPI report unlike any other in recent memory: the Bureau of Labor Statistics will not publish a year-over-year inflation rate. October 2025 prices were never collected during the federal government shutdown, so there is no base month to compare against. The BLS has said it will not publish 12-month changes for October 2026 for any index lacking an October 2025 value — including headline CPI and core CPI.
The last official annual rates are September's: 3.7% headline and 2.6% core.
What the BLS will publish, at 8:30 a.m. ET (13:30 GMT, 2:30 p.m. CET) on Tuesday, November 10, is the monthly change. Economists polled by Reuters expect headline CPI to rise 0.3% from September, with core CPI — which strips out food and energy — rising 0.2%. The Cleveland Fed's nowcast puts headline at 0.24% and core at 0.21%. RBC Economics forecasts 0.3% for both, citing energy spillover into core. Kalshi's market-implied headline figure is 0.28%. The entire market is clustered around a coin flip between a 0.2% and a 0.3% core print — and that one-tenth of a percent is worth billions in Bitcoin market value.
Why does a tenth of a percent matter so much? Because the BLS publishes monthly changes to one decimal place. An unrounded core reading of 0.25% or higher prints as 0.3%. An unrounded 0.24% prints as 0.2%. The Cleveland Fed nowcast of 0.21% and the Continuum Economics forecast of 0.22% sit just under the line. The market is, quite literally, balanced on a rounding boundary.
Why This CPI Decides the December Fed Hike
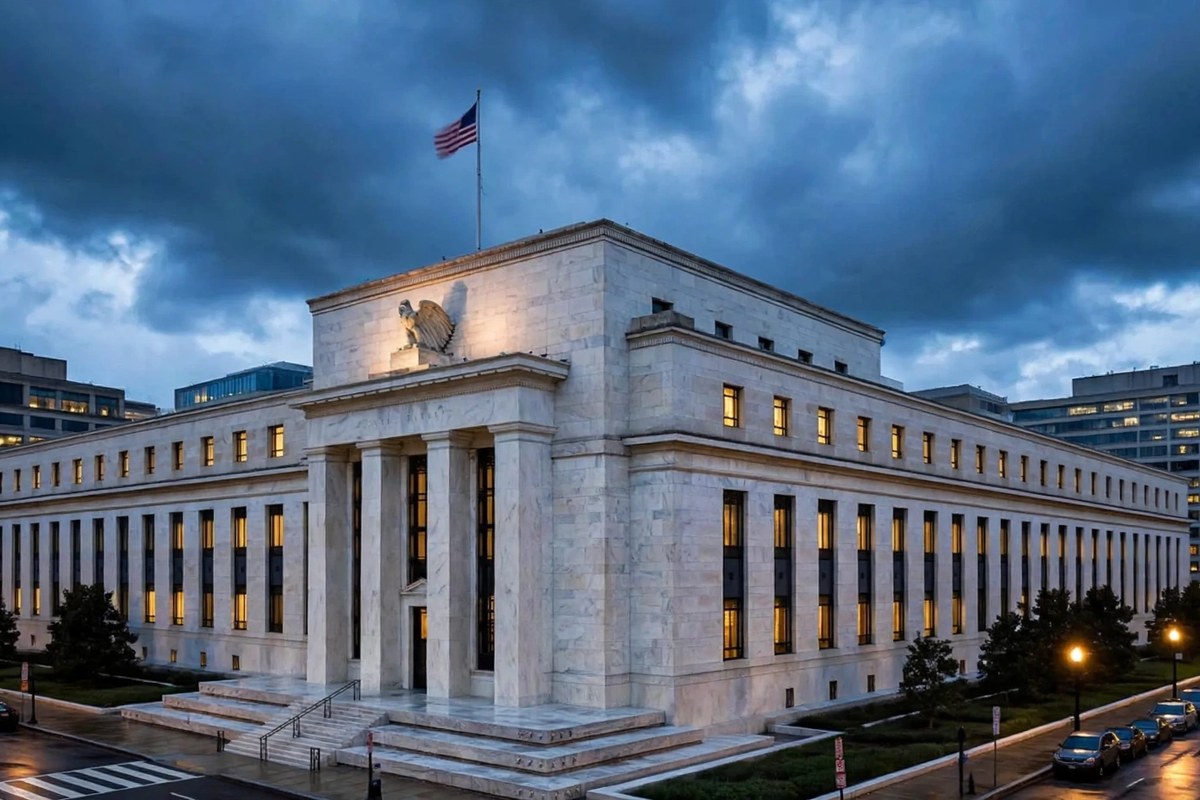
The Federal Reserve raised its target range to 3.75%–4.00% on September 16 — its first rate increase since 2023 — then held it on October 28 in a 10-to-2 vote, with Governor Lisa Cook and Cleveland Fed President Beth Hammack dissenting in favour of another quarter-point increase. Futures markets now price roughly an 81% probability of a December hike, according to CME's FedWatch tool cited by Reuters on November 9, with other measures putting it at 75% to 78%.
That pricing is the reason Tuesday's CPI is a binary event for Bitcoin. With a hike already priced at four-in-five odds, a hot core print changes almost nothing — the hike is already expected. A soft core print, on the other hand, is the one outcome that can still move markets, because it is the only result that would force traders to reprice December. As Forex.com's CPI preview puts it, only a notable downside surprise in inflation would be likely to drive significant market volatility. Bitcoin traders should read that sentence twice: the surprise risk is asymmetric, and it cuts in the bulls' favour.
The jobs data released on Friday, November 6, is why the Fed is in this position. October payrolls came in at 165,000 against a consensus near 59,000, with average hourly earnings up 0.4% on the month. The 10-year Treasury yield is above 4.9% and the 30-year above 5.3% — levels that punish every risk asset, from tech stocks to Bitcoin. Tuesday's CPI is the last full read on consumer prices the Fed gets before it votes on December 8–9. The November CPI report follows on December 10 — one day after the decision.

Five Scenarios for Tuesday Morning
Nobody knows Tuesday's number in advance. What you can do is decide your response to each outcome before the number hits, so you are not making decisions in the first 60 seconds of volatility — when the first spike is usually a liquidity grab, not the real move. Here are the five scenarios that cover the realistic range of outcomes, with the Bitcoin levels each one puts in play.
| Core CPI (month over month) | What it means | Bitcoin levels in play |
|---|---|---|
| 0.1% or lower — a soft surprise | December hike odds fall sharply; the 10-year yield drops; risk assets rally | Relief rally toward $78,000, then $80,000–$81,105 |
| 0.2% — in line with consensus | Hike odds stay near 80%; market focus shifts to the December 8–9 meeting | Range-bound between $74,000 support and $78,000; volatility fades within hours |
| 0.2% but with hot details (shelter, services) | Headline looks fine, but the Fed sees sticky underlying inflation | Initial pop fades; drift back toward $74,000 as hike odds firm up |
| 0.3% — hot, matching RBC's forecast | Hike becomes near-certain; odds of a second hike in early 2027 rise | Break below $74,000; test of the 200-day average near $73,200, then $70,000 |
| 0.4% or higher — a shock | Markets reprice a much more aggressive Fed; tech and crypto sell off together | Fast move toward $70,000; a break opens the summer low near $68,000 |
Three things to note about this table. First, the probabilities are not equal: the nowcasts cluster at 0.21%–0.22% core, so the market's base case is a 0.2% print, and the surprise risk is tilted toward a soft 0.1% rather than a hot 0.4%. Second, the levels are analysis, not predictions. Third, the first move after 8:30 a.m. ET is often fake — algo-driven spikes in the first minute routinely reverse within the hour. The real move is the one still standing at the US market open.
What Most People Get Wrong About CPI and Bitcoin
Here are the five mistakes that cost people money every CPI day.
Myth 1: The Fed watches CPI. The Fed's preferred inflation gauge is core PCE, not CPI. CPI matters because it arrives first and feeds directly into rate expectations — it moves markets more than PCE does, even though the Fed officially targets PCE. The November PCE data arrives after the December meeting, so Tuesday's CPI is the last word before the vote either way.
Myth 2: The year-over-year number is the important one. This time there is no official year-over-year number at all. Anyone quoting an annual October inflation rate on Tuesday is quoting a model estimate. The month-over-month core figure is the only official number that matters.
Myth 3: A hot CPI always crashes Bitcoin. Bitcoin has fallen after every post-pause Fed hike since 2016, but CPI itself is not the hike — it is the signal. When a hot print is already expected, as it is this time, the damage is often already in the price. Bitcoin is down roughly 40% from its all-time high; much of that decline is the market pricing in the hawkish Fed Tuesday's CPI would confirm.
Myth 4: Bitcoin is an inflation hedge, so hot CPI should be good for it. In theory, scarce assets should benefit from inflation. In practice, Bitcoin has traded as a risk asset throughout 2026, falling when the Nasdaq falls and rallying when rate-cut odds rise. Hot inflation means higher rates for longer, and higher rates mean less appetite for volatile assets.
Myth 5: The CPI reaction happens in one minute. The first spike is usually a liquidity grab. The durable move comes after traders read the details — shelter costs, services inflation, and the unrounded figures — and after the US stock market opens.
The 5 Numbers That Decide $70,000 or $80,000
- Core CPI month over month (Tuesday 8:30 a.m. ET): 0.2% is the line. Below it, relief. At 0.3% or above, the $73,200 support is in play. Remember the rounding trap: 0.24% prints as 0.2%, 0.25% prints as 0.3%.
- December hike odds after the print (CME FedWatch): if odds fall below 60% on a soft print, expect a sharp Bitcoin rally. If they rise above 90% on a hot print, expect selling to accelerate into the US open.
- Bitcoin ETF flows on Tuesday and Wednesday: US spot Bitcoin ETFs lost $1.16 billion in three days in late October, then saw a $74.6 million inflow on November 4 before another $430.2 million outflow on November 5.
- The 50-week moving average at $75,733: Bitcoin is trading below it now. Reclaiming it on a soft CPI would be the first technical repair in a week.
- Thursday's producer price data (November 13): PPI follows CPI and feeds into the same Fed decision. A hot CPI followed by a hot PPI would lock in the December hike.
CPI-Day Checklist for Bitcoin Holders
If you hold Bitcoin through Tuesday's release, do the preparation now, not at 8:29 a.m. ET.
- Decide your levels before the print: write down the price at which you would buy more and the price at which you would trim. The 0.2% versus 0.3% core print maps to the $74,000 and $73,200 levels in the scenario table above.
- Do not use leverage into the release: more than $1 billion in positions were liquidated in 24 hours on November 5, with longs absorbing nearly 90%. CPI morning is the worst time of the month to be leveraged.
- Check your exchange and wallet access in advance: volatility spikes bring exchange outages. Make sure your coins are stored properly. Our guide to storing Bitcoin safely in 2026 covers the seven steps that matter.
- Wait for the details, not the headline: the unrounded core figure and the shelter component matter more than the rounded headline.
- Watch the 10-year Treasury yield: if it breaks higher on a hot print, Bitcoin will struggle regardless of crypto-specific news. If it falls on a soft print, the relief rally has room to run.
- Remember the calendar after Tuesday: PPI on November 13, the December 8–9 FOMC meeting, and the November CPI report on December 10.
What Happens After Tuesday
Whatever Tuesday brings, the story does not end at 8:30 a.m. ET. If core CPI prints soft at 0.1% or 0.2%, the relief rally faces its first test at $78,000, then at the $80,000–$81,105 resistance band. A reclaim of $81,105 would be the first sign that the October–November downtrend is breaking. If CPI prints hot, the test is on the downside: $73,200, then $70,000.
The bigger question is whether the December 8–9 Fed meeting delivers a hike and, more importantly, what the Fed signals about 2027. A hike that comes with dovish guidance — language suggesting the tightening cycle is ending — could be better for Bitcoin than a hold that comes with hawkish warnings. Tuesday's CPI is only the first of three data points, with PPI on November 13 and the November CPI report on December 10 completing the picture.
For long-term holders, the context is worth remembering. Bitcoin is 40% below its October 2025 all-time high, the total crypto market is 38.5% below its peak, and ETF outflows of $1.16 billion in three days show institutions are cautious, not capitulating. The market has survived every previous crash, but the timing of recoveries has varied widely. If you are building a position rather than trading the news, our five-step Bitcoin investment plan for 2026 explains how to think about entries during exactly this kind of drawdown, and our explainer on how Bitcoin ETFs work explains why their flows have become the single most important driver of the spot price. If you are choosing where to trade the volatility, our ranking of the best crypto exchanges in the US for 2026 compares fees and reliability under stress.
The contrarian case is also worth stating plainly. Analyst Benjamin Cowen, who called this crash, now says Bitcoin could fall to $44,000 — a view we covered in our analysis of Cowen's $44,000 floor call. If he is right, Tuesday's CPI is a sideshow and the real move is much lower. If he is wrong, a soft CPI print is the catalyst that starts the repair. Either way, the number lands at 8:30 a.m. ET on Tuesday — and for the first time in years, there will be no annual figure to argue about. Just one monthly number, rounded to one decimal place, deciding $70,000 or $80,000.
FAQs
When is the October CPI report released?
Tuesday, November 10, 2026, at 8:30 a.m. ET (13:30 GMT, 2:30 p.m. CET).
What is the expected October CPI?
Economists polled by Reuters expect headline CPI to rise 0.3% month over month and core CPI to rise 0.2%. The Cleveland Fed's nowcast is slightly softer at 0.24% headline and 0.21% core.
Why is there no year-over-year CPI number this time?
The Bureau of Labor Statistics never collected October 2025 prices during the federal government shutdown, so there is no base month for a 12-month comparison. The BLS will not publish annual rates for October 2026. The last official annual rates are September's 3.7% headline and 2.6% core.
How does CPI affect Bitcoin price?
CPI moves Bitcoin through Fed rate expectations. A hot core print raises the odds of a December rate hike — currently priced near 81% — which pushes Treasury yields higher and pressures risk assets including Bitcoin. A soft print does the opposite. Bitcoin has traded as a risk asset throughout 2026, falling with tech stocks.
What Bitcoin price levels matter after the CPI report?
On the downside, $74,000 is the immediate support, then the 200-day moving average near $73,200, then $70,000. On the upside, $78,000 is the first test, then the $80,000–$81,105 resistance band from the post-midterm peak. Bitcoin is currently trading below its 50-week moving average of $75,733.
What happens if CPI comes in hot?
A core print of 0.3% or higher would make the December hike near-certain and raise the odds of further tightening in early 2027. Expect selling pressure toward $73,200 and potentially $70,000. A print of 0.4% or higher could trigger a fast move toward the summer low near $68,000.
Conclusion
Tuesday's CPI report is the most consequential 60 seconds of the month for Bitcoin — not because inflation itself has changed, but because it is the last data point the Fed sees before deciding on a December rate hike that markets already price at roughly 81%. Bitcoin sits at $74,500, below its 50-week moving average, with $1 billion in liquidations behind it and a $6.3 billion exchange hack still hanging over sentiment. The difference between a 0.2% and a 0.3% core print is one-tenth of a percent on a rounding boundary — and the difference between a relief rally toward $80,000 and a breakdown toward $70,000.
The smart move is not to predict the number. It is to know your levels, avoid leverage into the release, wait for the details behind the headline, and remember that there will be no annual figure to hide behind this time. At 8:30 a.m. ET on Tuesday, the market gets one clean number. Make sure you know what you will do with each version of it before it arrives.
Disclaimer: This article is for informational and educational purposes only and does not constitute financial advice. Cryptocurrency prices are volatile. Do your own research and consider speaking to a qualified financial adviser before making any investment decision.