XRP at $1.09: It Just Broke Its Triangle — 5 Numbers That Decide $1.00 or $1.22
XRP broke its three-month triangle and fell to $1.09 — the weakest major coin today — as $900 million of XRP flooded into Binance in a single day. These 5 numbers decide whether $1.00 or $1.22 comes next.

XRP fell to $1.09 on Monday, November 9 — down 7% in 24 hours, the weakest of the major coins — after breaking out of the symmetrical triangle that had contained it since August. And while the price was sliding, roughly 691 million XRP, worth about $900 million, flooded into Binance in a single day, the largest one-day whale inflow since 2024. Those two facts together decide everything from here: XRP is testing the $1.08 level that stands between it and the psychological $1.00 line, and Tuesday's US inflation report will likely decide which way it breaks.
The triangle break matters because it ends a three-month compression pattern. The whale inflow matters because it is the single biggest exchange deposit signal XRP has produced in two years. And the timing matters because the market is walking into the October CPI report on Tuesday, November 10, at 8:30 a.m. ET with the Federal Reserve's December rate decision hanging on the number. Here is what actually happened, the five numbers that decide what comes next, and the scenarios traders are pricing in.
What happened to XRP today
XRP opened Monday at $1.1528, touched a high of $1.1543, then slid to an intraday low of $1.0764 before settling near $1.09. Finnhub data puts the day's decline at 5.5%, while other feeds tracking the full 24-hour window put the drop closer to 7% — either way, it was the sharpest fall among the large-cap coins. Bitcoin fell about 1.7% over the same period to around $74,400, Ethereum dropped roughly 5% to $2,130, and Solana slipped about 3% to $86. XRP's decline was worse than all of them.
The damage is not just a one-day story. XRP is now down about 13% over the past seven days, down 21% over the past month, down 41% year to date, and down 56% over the past year, according to Finnhub. The token's market value has shrunk to roughly $68.8 billion. Just five days ago, on November 4, XRP briefly recovered toward $1.34. It has since lost roughly 19% in less than a week, breaking $1.20, then $1.15, then $1.10 in sequence.
The wider market did not help. More than $1 billion in leveraged crypto positions were liquidated in 24 hours, with $913 million of that in long positions, according to CoinGlass data reported by CoinDesk. US spot Bitcoin ETFs lost $1.28 billion last week, the largest outflow in four months. The Crypto Fear & Greed Index reads 29, firmly in "Fear" territory. XRP did not fall in isolation — but it fell further and faster than the market around it, and the technical picture explains why.
The triangle break: why this fall is different from the last ones
Since August, XRP had been trading inside a symmetrical triangle — a pattern formed by a descending line from the August spike high near $1.70 and an ascending line from the August low near $0.98. Triangles compress price. They end with a breakout in one direction, and the direction of the break usually sets the trend for weeks. In the first week of November, XRP broke the lower line of that triangle, and the line it broke — near $1.22 — is now overhead resistance instead of support.
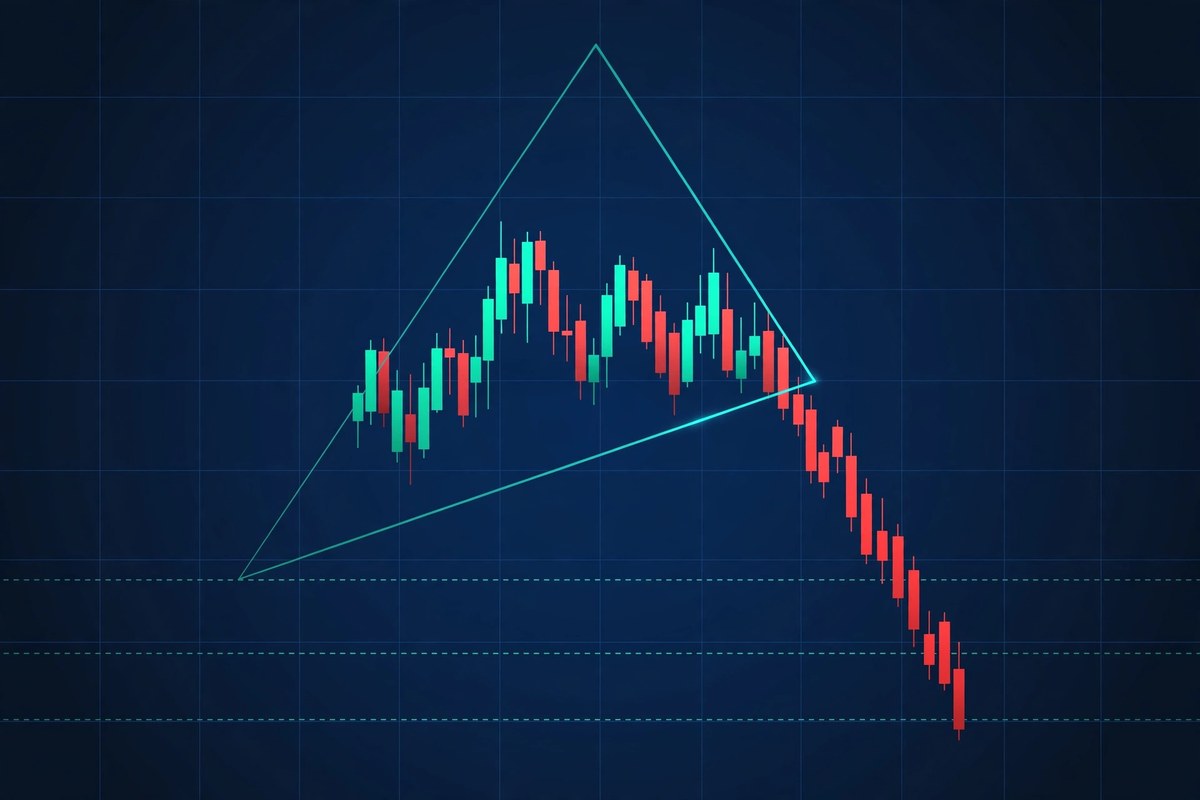
That matters for two reasons. First, a triangle that took three months to build does not usually resolve quietly: measured-move logic suggests the break can carry price a distance roughly equal to the height of the triangle's base, which points toward the $0.90 area if sellers stay in control. Second, the break happened alongside a clean sweep of every major moving average. XRP now trades below its 50-day average near $1.38, its 100-day average near $1.31, and its 200-day average near $1.27. When a coin sits below all three, trend-following funds and systematic traders treat it as a downtrend until proven otherwise.
The daily RSI (14) reads about 31.6, according to CoinLore — close to oversold, but not yet at the level where bounces have historically started for XRP. That is the uncomfortable part of the setup: momentum is stretched, but it has not yet produced the capitulation signal that usually marks a durable low. Analyst CasiTrades flagged $1.10 as a key Fibonacci level — it aligns with both the local 0.854 retracement and the macro 0.786 retracement — and warned that the RSI still signals strong selling momentum even at these levels.
The $900 million whale question
The most eye-catching number of the day is not the price. It is the flow. Market analyst Darkfost reported on X that approximately 691 million XRP entered Binance in a single day as the price fell below $1.30 — about $900 million at the prices of the time — marking the largest daily whale inflow to the exchange since 2024 and surpassing the previous record set during the February 2026 capitulation episode, as reported by Blockonomi.

Large inflows to an exchange are usually read as selling pressure: coins move to exchanges to be sold. But that reading needs a caveat, and this is where most commentary gets it wrong. The same week produced the opposite whale signal too. On-chain data reported by CryptoFrontNews showed whales accumulated about 16.46 million XRP between November 4 and 7, while the price was moving toward $1.10. So one group of large holders was buying the dip while another group was depositing hundreds of millions of dollars' worth of XRP onto Binance. Both things can be true at once: whales are not a single actor, and in a falling market, accumulation by some and distribution by others is exactly what a bottoming process looks like — messy, contradictory, and unresolved.
Until the inflows slow or the price reclaims a level, the $900 million spike signals possible pressure, not a confirmed whale sell-off. What it does confirm is that the biggest holders are active, not asleep — and in a market where only five of the top 100 coins gained even 1% in 24 hours, activity cuts both ways. For a fuller explanation of how large holders move markets, see our guide on what XRP is and how the XRP Ledger works.
5 numbers that decide whether $1.00 or $1.22 comes next
Forget the noise. Five numbers decide XRP's next move, and every one of them is already on the chart or the calendar.
| Number | What it is | Why it matters |
|---|---|---|
| $1.08 | Monday's intraday low and immediate support | The line in the sand. A daily close below it exposes $1.05, then the psychological $1.00 level. |
| $1.10–$1.12 | Fibonacci support zone, now the first reclaim target | XRP must recover this range to show buying momentum is returning. Failure here keeps sellers in control. |
| $1.22 | The broken triangle floor, now resistance | Reclaiming $1.22 would undo the triangle break entirely. Until then, every rally into it is a selling opportunity for bears. |
| 31.6 | Daily RSI (14) | Near oversold, but not reversing yet. A bounce from here is possible; a push below 30 would signal capitulation — or the final washout before a bottom. |
| 0.2% | Expected October CPI, reported Tuesday, Nov 10 | The macro trigger. A hotter-than-expected print keeps a December Fed hike priced near 80% and pressures all risk assets; a soft print could spark the relief rally XRP needs. |
The support ladder below current prices is short and steep: $1.08, then $1.05, then $1.00 — the psychological level that held in August and marks the August triangle low near $0.98. Below that, analysts point to $0.90 as the next technical level. Above, the resistance ladder is $1.10–$1.12, then $1.14, then $1.15 (the old support that has now flipped to a selling zone), then $1.22. The gap between $1.08 support and $1.22 resistance is the whole trade: roughly 13% of range, and whichever side breaks first likely sets the direction into the end of November.
Bull, base, and bear: three scenarios for XRP
Predictions are not facts, and no scenario below is a guarantee. But the levels are real, and they give every holder a concrete plan instead of a feeling.
| Scenario | Trigger | Price path | Probability read |
|---|---|---|---|
| Bull — relief rally | $1.08 holds, CPI comes in soft, Bitcoin reclaims $76,000 | $1.10–$1.12 reclaimed, then $1.15, then a test of $1.22 | Needs two things to go right at once; the weakest case until proven otherwise |
| Base — grind and chop | $1.08 holds but rallies stall at $1.14–$1.15 | Range-bound between $1.05 and $1.15 while the market waits for the Fed's December decision | The most likely path while RSI stays near 30 and whale flows stay mixed |
| Bear — $1.00 test | Daily close below $1.08, hot CPI, Bitcoin loses $73,150 | $1.05, then $1.00, with $0.90 as the measured-move target from the triangle break | Live risk: XRP has already lost three support levels in five days |
The base case deserves emphasis because it is the least exciting and the most probable. XRP has fallen 19% in five days, and markets rarely fall in a straight line. In the base case, XRP chops between $1.05 and $1.15 for days, shaking out leveraged traders on both sides, until the December 8–9 FOMC meeting gives the market a real direction. Traders who treat every $0.03 bounce as the bottom are the ones who get hurt in that kind of market. Our explainer on how crypto liquidations work — and the five mistakes that wipe traders out — is worth reading before touching leverage in conditions like these.
Why XRP fell harder than Bitcoin this time
XRP's 7% drop against Bitcoin's 1.7% is not random. Three forces hit XRP specifically. First, the triangle break was a technical event with no Bitcoin equivalent: Bitcoin is stuck between its own 200-day average near $73,150 and its 100-day average near $77,430, but it has not broken a multi-month pattern. XRP has. Second, the whale inflows were XRP-specific — the $900 million Binance deposit is the largest since 2024, and it arrived exactly as the price lost $1.30, then $1.20, then $1.15. Third, XRP had further to fall from a positioning standpoint: it had already lost its $1.20 support and closed on November 7 near $1.16, its lowest daily close in 30 days, before Monday's selling even began.
The macro backdrop amplified all of it. The Democrats' sweep of Congress, the Nvidia CEO investigation that knocked tech stocks lower, stalled US–Iran talks, and a hot jobs report (165,000 payrolls against 65,000 expected) that kept a December Fed hike priced near 80% — all of it pushed investors toward risk-off, and altcoins always fall harder than Bitcoin in risk-off moves. Bitcoin's dominance sits near 60%, and in a fear-driven market, capital hides in Bitcoin first.
What most people get wrong about XRP at $1.09
Myth 1: "Whales are dumping, so XRP is finished." The $900 million inflow is real, but whales also accumulated 16.46 million XRP in the same week. Whale flows are a weather report, not a verdict. The February 2026 capitulation episode that set the previous inflow record was followed by a recovery — large inflows mark stress, and stress marks both tops and bottoms.
Myth 2: "The RSI is oversold, so it has to bounce now." An RSI of 31.6 is near oversold, not oversold, and oversold coins can stay oversold for days. A bounce needs a trigger — a soft CPI print, a Bitcoin reclaim of $76,000, or a visible slowdown in exchange inflows. Until one arrives, "oversold" is a description, not a buy signal.
Myth 3: "Losing $1.00 means XRP is dead." The $1.00 level is psychological, and psychology cuts both ways: it is also the level where buyers stepped in during August, when the triangle's lower boundary sat near $0.98. A test of $1.00 would be painful for recent buyers, but it would also be the first test of a level that has held before — and the level where the measured-move target from the triangle break sits just below, at $0.90.
Myth 4: "The CPI report will save or kill XRP by itself." Tuesday's CPI matters, but it is one data point in a month that also holds the December 8–9 FOMC meeting, the SEC's crypto broker-dealer rules now under White House review, and the delayed XRPL bug fix that our earlier coverage flagged. CPI sets the tone for the week; it does not rewrite XRP's technical structure. Even a soft print leaves XRP below its 200-day average, and even a hot print leaves $1.00 support intact until it is actually tested.
What to watch next
The next 48 hours have a clear checklist. First, Tuesday, November 10, 8:30 a.m. ET: the October CPI report. The market expects a 0.2% monthly print, and anything hotter keeps the December hike priced near 80% and keeps pressure on XRP's $1.08 support. Second, the daily close: XRP needs to close above $1.10 to start repairing the damage, and a close below $1.08 would open the path to $1.05 and $1.00. Third, the whale flows: if Binance inflows slow while the price holds $1.08, the selling is exhausting itself; if inflows stay elevated, the pressure continues regardless of the CPI print.
Fourth, Bitcoin's $73,150 level — the 200-day average that has held so far. If Bitcoin loses it, altcoins including XRP will almost certainly make new lows with it. And fifth, the delayed XRPL bug fix, which remains an overhang from our earlier reporting on the network's postponed patch. A firm date for the fix would remove one piece of uncertainty; continued silence leaves it hanging over every rally attempt. If you are considering buying XRP at these levels, our beginner's guide to buying XRP safely covers exchanges, wallets, and the mistakes first-time buyers make — and our honest look at whether XRP is a good investment in 2026 puts today's price in the context of the full year, not just the last five days.
Frequently asked questions
Why is XRP down today?
XRP fell to about $1.09 on November 9, down roughly 7% in 24 hours, after breaking the lower line of a symmetrical triangle that had contained it since August. The drop was amplified by about $900 million in whale inflows to Binance — the largest single-day inflow since 2024 — and by a broad risk-off move that saw more than $1 billion in crypto liquidations and $1.28 billion in weekly Bitcoin ETF outflows. XRP was the weakest major coin of the day.
What is the next support level for XRP?
Immediate support is $1.08, Monday's intraday low. Below that, the next levels are $1.05 and then the psychological $1.00 level, which held in August. Analysts point to $0.90 as the measured-move target if the triangle breakdown fully plays out. On the upside, XRP must first reclaim $1.10–$1.12, then $1.15, then $1.22 — the broken triangle floor — to repair the technical damage.
Is XRP oversold at $1.09?
Almost, but not quite. The daily RSI (14) reads about 31.6, close to oversold territory (below 30) but still falling rather than turning. Oversold conditions can persist for days in a downtrend, so the RSI alone is not a buy signal. A bounce becomes more likely if $1.08 holds and Tuesday's CPI report comes in softer than expected.
What does the $900 million Binance inflow mean?
Approximately 691 million XRP was deposited to Binance in a single day, the largest daily whale inflow since 2024, according to analyst Darkfost. Large exchange inflows are usually read as potential selling pressure, since coins move to exchanges to be sold. However, other whales accumulated about 16.46 million XRP in the same week, so the flows are mixed — the inflow signals stress and possible pressure, not a confirmed mass sell-off.
Will the CPI report on November 10 move XRP?
Very likely, yes. The October CPI report is released Tuesday, November 10, at 8:30 a.m. ET, and the market expects a 0.2% monthly increase. A hotter print would keep a December Fed rate hike priced near 80% and pressure risk assets including XRP, potentially testing $1.08. A softer print could trigger a relief rally toward $1.15. Either way, CPI sets the tone — but XRP still needs to reclaim $1.22 to undo the triangle break.
Should I buy XRP at $1.09?
There is no single right answer, and this article is not financial advice. The bull case is that XRP is down 56% over the past year, sits near oversold, and has strong support at $1.00–$1.08 with a clear catalyst in Tuesday's CPI. The bear case is that XRP just broke a three-month pattern, trades below all three major moving averages, and faces $900 million of whale exchange inflows. Anyone buying here should decide in advance which level invalidates the trade — for most traders, a daily close below $1.08 is that line — and should never use leverage in a market that just liquidated $1 billion in 24 hours. Our guide to the Crypto Fear & Greed Index explains how to read sentiment readings like today's 29 ("Fear") without letting them make the decision for you.
Conclusion
XRP at $1.09 is a coin at a decision point, not a coin in freefall — yet. The triangle break is real, the $900 million whale inflow is real, and the 19% slide from $1.34 in five days is real. But so is the $1.08 support that held on Monday, so is the $1.00 level that held in August, and so is the fact that the RSI is one push away from the oversold territory where XRP has bounced before. Tuesday's CPI report will likely decide which story wins the week. If $1.08 holds and the print is soft, $1.15 and then $1.22 are back in play. If $1.08 breaks on a hot print, $1.00 is next, and $0.90 is the level the triangle itself points to.
Disclaimer: This article is for informational purposes only and is not financial advice. Cryptocurrency prices are volatile, and the levels discussed are technical observations, not guarantees. Always do your own research before buying or selling any asset.