Bitcoin Price Prediction November 2026: Top Traders Bet $2.37B That BTC Falls — While Retail Goes Long
Top traders on Hyperliquid, Lighter, dYdX and Pacifica hold $2.37 billion in Bitcoin shorts against just $158 million in longs — a 94% short share — while Binance retail sits 75.5% long. One side is about to be very wrong, and $76,500 decides which.

Bitcoin is trading at $75,722, roughly 40% below its all-time high — and the traders who have been right most often this year are betting it goes lower. A snapshot taken on the morning of November 8 shows the 100 best-performing traders on four major perpetual exchanges holding about $2.37 billion in short positions against just $158 million in longs: a 94% short share. At the same moment, ordinary traders on Binance are 75.5% long. Two crowds, opposite bets, $2.37 billion on the line — and the price level that decides who is right is only 1% away.
It is hard positioning data, published hours ago — and it comes with a warning from four days ago, when the last crowded short book squeezed Bitcoin from $75,700 to $81,004 in 12 hours and wiped out $560 million of shorts. Here is what the data says, what it does not say, and the three levels that decide $70,000 or $85,000.
The $2.37 Billion Bet, in Plain Numbers
The headline figure comes from aggregated derivatives positioning data across Hyperliquid, Lighter, dYdX and Pacifica, reported by COINOTAG on November 8. In the 06:06 UTC snapshot, the 100 most profitable accounts over the trailing 24 hours on those four venues held roughly $158 million in long futures positions against about $2.365 billion in shorts — a 93.7% short share. Bitcoin was the centre of the bet: in the 24-hour Bitcoin group, 60 traders were long and 160 were short, with about $38 million of long exposure against $738 million short — a long share of roughly 5%.
The tilt is not a one-hour fluke. The 7-day Bitcoin cohort counts 73 long accounts against 161 short, and the 30-day group runs 75 long to 186 short. The single largest position tracked on Hyperliquid right now is a $178.26 million Bitcoin short using 5x leverage, according to live whale-tracking data. Across all 1,112 tracked Hyperliquid positions worth $1 million or more, shorts total $3.73 billion against $2.97 billion of longs.
Before drawing conclusions, the honest caveats matter. These cohorts are re-selected every hour by trailing performance, so membership turns over almost constantly; the swing from 81% long to 94% short is partly re-composition, not the same accounts reversing their bets. The tally covers only top-100 positions on four venues, which lets single large books dominate the total. And spot holdings, positions on other exchanges and hedge status stay invisible — a trader who is short on Hyperliquid may be long on spot, making the "short" a hedge rather than a directional bet. The $2.37 billion figure is a dated snapshot of one corner of the market, not a census of everyone betting on Bitcoin. Even so, it is the most one-sided professional positioning print of the month, and it arrived on a morning when Bitcoin was already sitting on its most important support level.
Two Crowds, Opposite Bets
What makes this moment genuinely unusual is not that professionals are short. It is that everyone else is long at the same time. Live long/short data from Binance — the largest centralised exchange — shows retail accounts 75.5% long on Bitcoin, with top traders on that venue 65.2% long by position. Taker flow is almost balanced, with $2.30 billion of aggressive buying against $2.23 billion of aggressive selling over the last four hours.
History says this kind of split usually resolves violently in one direction, and the side that has been right recently tends to win the first round. The perp-DEX cohort earned its place on the leaderboard by being short during a month in which Bitcoin fell 7.2% and is down 25.9% over the past year. The Binance crowd has been buying every dip of a 40% drawdown from the October 2025 all-time high of $126,080. One side is trading the trend; the other is trading the hope that the trend ends.
There is a second tension worth naming. Funding rates — the periodic payments between longs and shorts on perpetual contracts — tell a conflicting story depending on when you look. On November 2, Bitcoin's 8-hour funding rate fell to -0.014%, an annualised skew of -15.3% with a 30-day Z-score of -2.38, meaning shorts were paying longs an extreme premium to stay bearish — the classic signature of overcrowded short positioning, as FinPulse 360 reported at the time. By November 8, funding had flipped back to +0.0100% per eight hours, with longs paying shorts. The extreme has eased, but the underlying pile has not: the shorts are still there, they are just paying less to wait.
It Happened Four Days Ago — and It Was Brutal
Anyone who doubts that a crowded short book can move Bitcoin thousands of dollars in hours should look at what happened on November 4. Bitcoin fell to about $75,700 on election night as the US midterm results came in, attracting fresh shorts from traders expecting support to break. Instead, the price turned, reclaimed $80,000 and peaked at $81,004 — a 7% round trip in roughly half a day. About $950 million of leveraged crypto positions were liquidated in 24 hours, and roughly $560 million of that came from short positions. In a single hour at the breakout, about $378 million of shorts were liquidated, making up 81% of all forced closures in that window.
The detail that matters most is what did not happen during that rally: open interest barely expanded. Rising volume with flat-to-declining open interest means the move was driven by short covering — forced buying from traders closing losing bets — rather than fresh leveraged longs piling in. That is why it was so fast, and why it stopped where it did: once the most crowded shorts were cleared, there was no new money to carry the rally further, and Bitcoin slid straight back to $75,700 within two days. The lesson is not that squeezes always happen. It is that when positioning gets this one-sided, the move — in whichever direction it finally breaks — tends to be bigger and faster than anyone expects.
Our own coverage of that event is worth revisiting for the mechanics: Bitcoin's $378M Short Squeeze: BTC Reclaims $80,000 in 12 Hours breaks down the liquidation cascade hour by hour, and Crypto Liquidations Explained: $1 Billion Wiped Out in 24 Hours explains how leverage turns a 7% move into a total loss for a 15x trader. If you are new to how perpetual contracts work, start with What Are Crypto Perpetual Futures? — it explains funding rates, the same mechanism now charging shorts to wait.
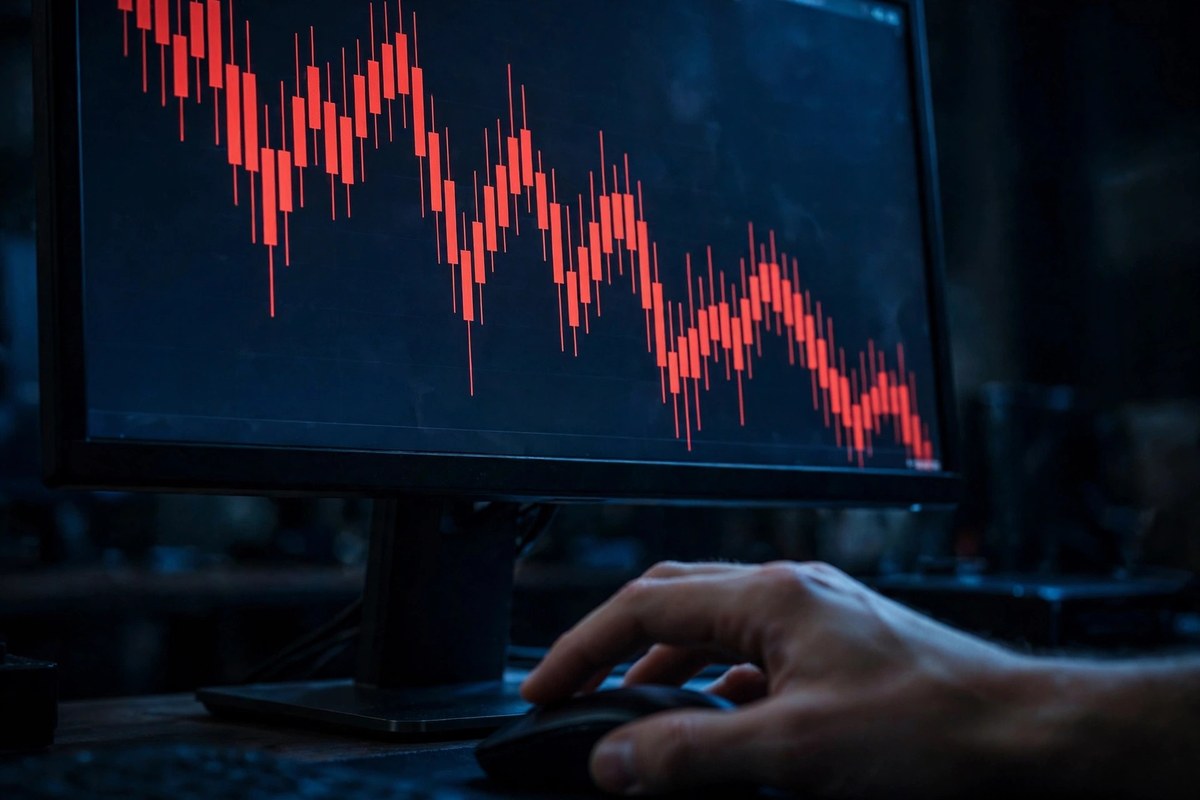
The Three Levels That Decide Everything
Positioning data is only useful if it is tied to prices. The liquidation map gives us three levels that matter more than any opinion, and all three sit within 2% of the current price. The largest short liquidation cluster sits at $76,810 — just 1.5% above the current price — holding about $28.6 million of forced buy-stops. Total short liquidity above the price is $204.8 million; total long liquidity below is $204.5 million. The trigger levels are what matter: a push above $76,500, the upper liquidation wall, starts forced buying, while a break below $74,250, the lower wall, starts forced selling. The flip point — where liquidations below equal liquidations above — sits at $75,500. Bitcoin is trading at $75,722. It is, quite literally, balanced on the line.
Support underneath is equally tight. The 50-week moving average sits near $75,562, and Bitcoin has been resting on it for two days. The bid wall is at $74,200 with 407 BTC resting there; the ask wall is at $75,750 with 406 BTC, according to live positioning data. This is a market coiled into a $2,000 range between $74,250 and $76,500, with $2.37 billion of professional money betting the break goes down and a retail crowd betting it goes up.
| Scenario | Trigger | Price target | What confirms it |
|---|---|---|---|
| Bull — the squeeze repeats | Daily close above $76,500, then $76,810 | $80,000–$81,000, then $85,200 | Short liquidations spike; funding flips negative; ETF flows turn positive |
| Base — the range holds | Bitcoin stays between $74,250 and $76,500 | Chop between $75,000 and $77,000 | Low volume, funding near zero; CPI on Nov 10 decides the next move |
| Bear — the shorts are right | Daily close below $74,250 and the 50-week average | $70,000, then $65,000 | Long liquidations cascade; ETF outflows continue; hike odds pass 85% |
The bull case has the strongest precedent: the November 4 squeeze proved that this exact short pile can fuel a 7% rally, and the liquidation clusters above the price are dense — a break of $76,810 would force-buy $28.6 million of shorts in one band. Older data from November 2 even put $800 million of short stop-losses at $85,200, though that map is six days old and should be treated as a signpost, not a promise. The bear case has the strongest trend: Bitcoin is down 7.2% in a month and ETF outflows reached $869.8 million in the first four November sessions. The base case has the strongest excuse: with October CPI due on November 10 and PPI on November 13, both sides may simply wait for data. Our assessment: the base case is most likely for the next 48 hours, but the bull case has the better risk-reward — the shorts are the crowded side, and crowded sides are the ones that get carried out.
The Macro Weight on Both Sides
Positioning does not exist in a vacuum, and the macro picture explains why professionals are comfortable being short. The October jobs report came in hot — 165,000 new jobs against 65,000 expected — and within hours traders were pricing a December Federal Reserve rate hike at close to 80%, up from about 70% before the release. The Fed funds target range stands at 3.75% to 4.00% after a 25-basis-point hike in September, and the 10-year Treasury yield rose to 4.894% on the jobs data. Higher-for-longer rates are kryptonite for Bitcoin: on November 5 the Nasdaq lost 5.5%, wiping about $2.5 trillion off the Nasdaq 100, and Bitcoin fell with it.
The ETF flow data is just as grim. US spot Bitcoin ETFs recorded $430.2 million of net outflows on November 5 alone — led by Fidelity's FBTC at $199.9 million and BlackRock's IBIT at $105 million — and $411.9 million more on November 6. The four-session November total of $869.8 million in outflows means the institutional bid that carried Bitcoin to $126,080 last October has gone quiet. Add the Fear & Greed Index at 27–28, deep in fear, and short-term holders flipping from $49 billion in paper profit to a $162 million loss, and the bearish case writes itself.
But the same macro data cuts the other way if you look one step further. The hot jobs report that crushed crypto also pushed December hike odds to ~80% — which means the hike is now largely priced in, and any soft CPI print on November 10 would unwind those odds fast. Prediction markets are already split on whether Bitcoin even touches $70,000. And the buyers have not vanished: Strive acquired 15,124 BTC between October 1 and 30, and long-term holders keep adding while ETF holders sell. The market is not one-sided in conviction — it is one-sided in leverage.
What Most People Get Wrong About the 94% Number
The 94% short figure is already circulating on social media, and most of the takes are wrong. Here is what the number does and does not mean.
It does not mean 94% of all traders are short. It means 94% of the dollar exposure among the top-100 traders on four perpetual DEXs, ranked by trailing 24-hour profit, is short. Binance alone has millions of accounts, 75.5% of which are long. The 94% describes a small, elite, fast-moving cohort — not the market.
It does not mean shorts are losing money. When funding is negative, shorts pay longs; when it is positive, longs pay shorts. Right now funding is slightly positive, so shorts are being paid to wait. A short can be right, patient and profitable all at once — until the price moves 2% against it.
It does not guarantee a squeeze. A squeeze needs a trigger: a break above $76,500, a soft CPI print, a sudden ETF inflow. Without a trigger, the shorts can simply sit, collect funding and watch the price grind lower. Crowded positioning raises the odds of a violent move; it does not pick the direction or the day.
It does mean the next move will be fast. With $204.8 million of short liquidity above and $204.5 million of long liquidity below, the first 2% move in either direction will trigger forced closures that amplify it. That is the one prediction this data supports with confidence: whichever level breaks first, the follow-through will be sharper than a normal day. For anyone holding Bitcoin through the weekend, that is the practical takeaway — and it is why our guides on whether Bitcoin is a good investment in 2026 and the $72K–$80K bull-market support band are worth reading before Monday, not after.
Five Things to Watch Before Monday
Five signals will tell you which scenario is playing out. Check them in this order.
- Watch the $76,500 wall first. A daily close above it starts the short-liquidation cascade; a rejection keeps the bear case alive. The $76,810 cluster is the tripwire — $28.6 million of forced buying sits within 1.5% of the current price.
- Watch funding rates flip. If the 8-hour funding rate turns sharply negative again, shorts are paying heavily to stay bearish — the same extreme that preceded the November 4 squeeze. If it stays positive, the shorts are comfortable and patient.
- Watch Monday ETF flows. Five straight sessions of outflows would confirm institutions are still selling; a single $200M+ inflow day would signal the bid is back and the squeeze has fuel.
- Watch the Hyperliquid whale tracker. If the $178 million short starts shrinking, the biggest player in the cohort is covering — usually before the price moves, not after.
- Watch CPI on November 10. A soft print unwinds the 80% December hike odds and removes the macro reason the shorts are short. A hot print does the opposite and opens the door to $70,000.
For readers considering a first purchase into this volatility, our beginner guide How to Buy Bitcoin in 2026 covers exchanges, fees and first-timer mistakes — and What Is Bitcoin? explains why its fixed supply of 21 million coins matters when leverage, not supply, is moving the price.

Frequently Asked Questions
What does it mean that 94% of top traders are short on Bitcoin?
It means that among the 100 most profitable traders over the last 24 hours on Hyperliquid, Lighter, dYdX and Pacifica, about $2.37 billion of positions bet on Bitcoin falling, against $158 million betting on it rising. It describes one elite, fast-moving cohort on four venues — not all traders, and not the whole market. Binance retail accounts are 75.5% long at the same time.
What is a Bitcoin short squeeze?
A short squeeze happens when traders who bet on falling prices are forced to buy back Bitcoin as the price rises, and that forced buying pushes the price higher, forcing out more shorts. On November 4, Bitcoin rose from about $75,700 to $81,004 in 12 hours as roughly $560 million of short positions were liquidated. Our explainer Crypto Liquidations Explained walks through the mechanics with real examples.
What price would trigger a short squeeze for Bitcoin?
The first trigger is $76,500, the upper liquidation wall, with the largest single short cluster at $76,810 — about 1.5% above the current price of $75,722. A daily close above $76,810 would start forced buying. A bigger cascade would need a break above $80,000, the November 4 high.
Will Bitcoin fall to $70,000?
It is a real risk, not a certainty. A daily close below $74,250 and the 50-week moving average near $75,562 would open the path to $70,000, and some bearish projections point to $65,000. Prediction markets are split on whether $70,000 gets touched. The counterweight is the crowded short book itself: if $76,500 breaks first, forced buying could carry Bitcoin back to $80,000 before $70,000 is ever tested. See our earlier analysis Will Bitcoin Fall Below $70,000? for the full level-by-level breakdown.
Should I buy Bitcoin now while traders are short?
There is no single right answer, and this article is not financial advice. The data says two things at once: the trend and the macro backdrop favour the shorts, while the positioning is so one-sided that a break higher could move fast. Anyone buying should size the position for a possible drop to $70,000 first, and anyone shorting should size for a possible squeeze to $81,000. Our five-test checklist for buying crypto now is a useful framework before deciding.
How reliable is the $2.37 billion short figure?
It is a real snapshot from a real data source, but it has limits: the cohort is re-ranked hourly, single large books dominate the total, and spot holdings and hedges are invisible. Treat it as a strong signal about professional positioning on four venues, not as a complete picture of the market.
The Bottom Line
Bitcoin is caught between two crowds that cannot both be right. The traders who have made the most money in the last month hold $2.37 billion in shorts against $158 million in longs — a 94% short share — while ordinary traders on Binance sit 75.5% long. The price is balanced on the $75,500 flip point, with $204.8 million of short liquidity above and $204.5 million of long liquidity below. The last time the setup looked like this, four days ago, Bitcoin ripped 7% in 12 hours and liquidated $560 million of shorts. The next 48 hours — and the CPI print on November 10 — will decide whether history repeats or the shorts finally get paid.