Bitcoin After the 2026 Midterms: History Says It Falls First, Then Gains 53.7% on Average — 3 Patterns That Decide the Next 12 Months
Bitcoin has fallen after every midterm since 2014 — then gained 53.7% on average in the 12 months after. With BTC at ~$76,900 on election night, here are the 3 patterns that decide whether history repeats.

Bitcoin has fallen after every US midterm election since 2014 — and then gained 53.7% on average in the 12 months that followed. That is the uncomfortable, hopeful pattern facing every holder tonight, with Bitcoin trading near $76,900 on election night, November 3, 2026, after US spot Bitcoin ETFs lost $399 million in a single day and Binance customers pulled $4.72 billion from the exchange since it reopened. History says the next few weeks are usually the painful part. History also says the year after has usually been the rewarding part. This article explains both halves of that pattern, what is different this time, and the three signals that will tell you which version of history is playing out.
If you only remember one number from this article, make it this one: 53.7%. That is the average Bitcoin gain in the 12 months after the past three midterm elections, excluding 2010, according to CoinDesk's analysis of election-day closes. The catch is that getting to that gain has never been a straight line. In each of the last three cycles, Bitcoin bottomed somewhere between 13 and 71 days after Americans voted — so anyone who bought on election night and panicked in the following weeks sold into the exact window where the cycle low has historically been made.
Where Bitcoin Stands on Election Night
Bitcoin steadied near $76,900 on Tuesday, November 3, after dipping to around $76,300 in the European morning, according to CoinDesk. That puts the world's largest cryptocurrency roughly 39% below its all-time high of $126,156, and almost exactly on its rising 200-day exponential moving average of about $76,450. In plain terms, Bitcoin is sitting on the line that has separated longer-term uptrends from downtrends for most of its history. It is also sitting just above the $75,597 level that analysts are watching as the key support — the 50-week simple moving average — while resistance sits at $78,661, the 61.8% Fibonacci retracement level.
The immediate backdrop is ugly. US spot Bitcoin ETFs lost $399 million on Monday, November 2, their second straight day of outflows, with BlackRock's IBIT alone shedding $405 million — its largest daily outflow since June, according to Farside Investors data reported by CoinDesk. That followed a $643 million outflow on Friday, October 30, the largest since June 25. October as a whole ended with $515 million in net ETF outflows, breaking a three-month streak of positive monthly inflows. Spot Ethereum ETFs have now seen six straight days of outflows, including $139.7 million on Monday.
At the same time, the institutional picture is split rather than uniformly bearish. Strategy bought 811 BTC for about $65.5 million between October 26 and November 1, at an average price of $80,846 per coin — above where Bitcoin trades now — taking its holdings to 849,327 BTC at an average cost of $75,451, according to its 8-K filing. Treasury buyers are paying up while ETF holders sell. That split is the central tension of this market: one group of institutions is accumulating through the fear, and another is redeeming. If you want to understand how to read those flows rather than just react to the headlines, our guide to reading Bitcoin ETF flows breaks down the five signals that matter.
Then there is the Binance overhang. The exchange suffered a reported $6.3 billion security breach on October 29, and customers have withdrawn a net $4.72 billion since it reopened on Sunday, up from $3.64 billion on the first day. A further reminder that exchange risk is real arrived with news that Brazil's Mercado Bitcoin saw an estimated $40 million drained from hot wallets, according to security firm Hypernative.
The Three Midterm Patterns Every Holder Should Know
Three distinct patterns emerge from the midterm record, and they point in different directions over different time horizons. That is precisely why midterm season confuses so many investors: the short-term pattern is bearish, the medium-term pattern is constructive, and the long-term pattern is strongly bullish. Confusing the three is how people sell the bottom.
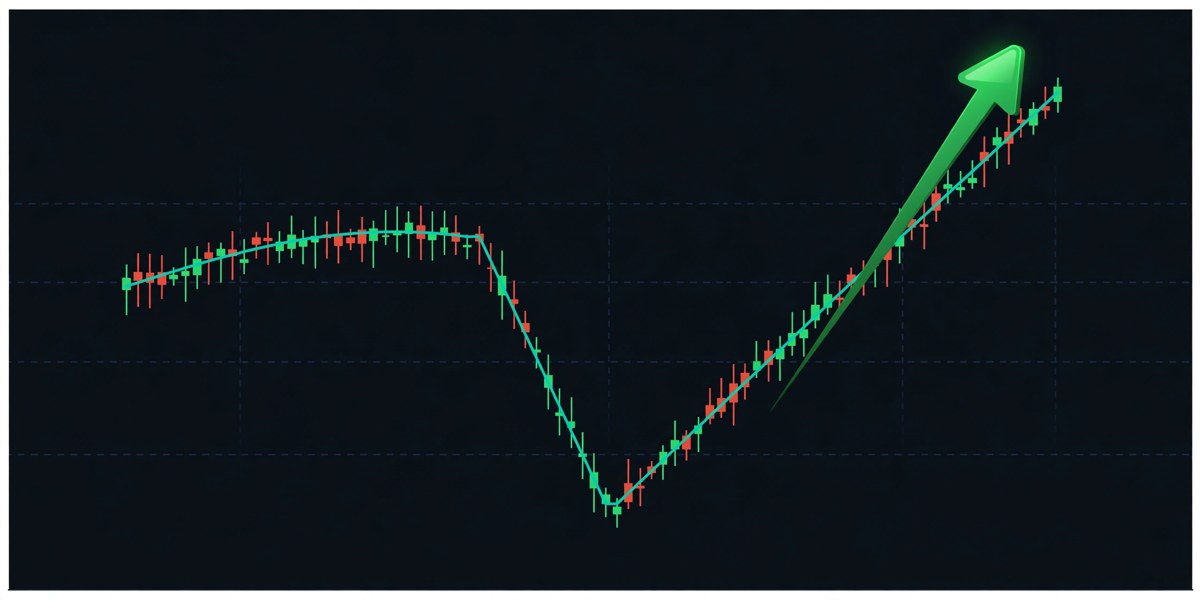
Pattern 1: Bitcoin falls first. Analyst Ali Martinez found that Bitcoin fell after four straight midterms: 72% after 2010, 65% after 2014, 52% after 2018 and 27% after 2022. The declines got smaller each time as the market matured, but the direction never changed. Crypto researchers separately found that Bitcoin's cycle low arrived 71 days after the 2014 vote, 39 days after the 2018 vote and 13 days after the 2022 vote. Counted from November 3, 2026, those gaps put a potential low somewhere between mid-November 2026 and mid-January 2027. Note the important nuance: the 2022 low was accelerated by the FTX collapse days after the election, so that 13-day gap was driven by a fraud crisis, not by voting itself.
Pattern 2: The year after has averaged 53.7%. CoinDesk's analysis found Bitcoin gained an average of 53.7% in the 12 months after the past three midterm elections, excluding the fringe 2010 market (which surged 1,579% from a tiny base). The S&P 500's record is longer and steadier: since 1950, it has risen an average of 15.17% in the year after midterms, more than double its 7.30% average in other years, according to Hartford Funds data cited by CoinDesk. Bitcoin's median November gain since 2013 is about 8.8%, excluding the 2013 outlier, according to CoinGlass data. Seasonality, in other words, is on the side of patient holders — but only after the initial post-election weakness.
Pattern 3: The market is not positioned for fireworks. Options traders are pricing a short burst of volatility, not a lasting storm. Bitcoin's implied volatility for options expiring November 4 sits around 43.5%, versus roughly 36% for later expiries, according to CoinDesk's Daybook analysis. Block Scholes found implied volatility around 38% surrounding the 2026 midterms, versus 63% around the 2024 presidential election. Futures open interest has held steady near $58 billion for Bitcoin, suggesting traders are buying insurance on positions they already hold rather than placing fresh bets — which means a surprise result, in either direction, would move prices more than the calm positioning suggests.
What History Actually Looked Like: The Midterm Table
The table below puts the three usable midterm cycles side by side. The lesson is not that history repeats exactly — it is that the sequence has repeated even when the causes were completely different.
| Midterm election | What happened next | Cycle low after the vote | 12 months later |
|---|---|---|---|
| 2014 | Bitcoin fell 65% after the vote; bear market bottomed in January 2015 | 71 days after the vote | Recovery into the next halving cycle |
| 2018 | Bitcoin fell 52% after the vote; bear market bottomed in December 2018 | 39 days after the vote | Recovery into the 2019–2020 rally |
| 2022 | Bitcoin fell 27% after the vote; FTX collapse days after the election drove the low near $16,000 | 13 days after the vote | Strong recovery through 2023 |
| 2026 (now) | Bitcoin near $76,900 on election night, 39% below its all-time high, with ETF outflows and the Binance hack weighing | Window: mid-November 2026 to mid-January 2027, if the pattern holds | Average of past three cycles: +53.7% (a historical average, not a forecast) |
There is a serious challenge to the "midterms did it" story, and honest analysis has to include it. Bitcoin's four-year halving cycle may explain the pattern better than politics. After each halving, Bitcoin rallied sharply, peaked 12 to 18 months later, and slid into a bear market — and those bear markets played out in midterm years: 2014, 2018, 2022 and now 2026. Under this reading, the post-midterm rebound is really a fresh cycle starting, not a political effect. Grayscale's head of research Zach Pandl made a related point in an October 28 note: the US accounts for only 15–20% of global crypto activity, so adoption continues regardless of who controls Congress. Both explanations can be partly true — and both point to the same practical conclusion: the months after a midterm have historically been a better time to accumulate than the weeks before it.
What Is Actually at Stake in Congress
Americans voted on Tuesday, November 3, for all 435 House seats, 35 Senate seats and 35 governorships. Prediction markets heavily favored a change in Washington: Block Scholes cited about a 90% chance of Democrats winning the House and a 65–70% probability of capturing the Senate, while Polymarket priced a Democratic sweep at 72% on more than $51 million in trading volume, and Kalshi matched its all-time high of 70% for the same outcome. A Bloomberg survey conducted October 2–17 found that a surprise Republican sweep could send Bitcoin back above $90,000 by year-end — a reminder that markets have largely priced in divided government, so the surprise direction is a Republican hold.
For crypto specifically, the stakes are about legislation, not just sentiment. A Democratic takeover of at least one chamber could complicate new crypto legislation, including the market-structure bill known as the CLARITY Act, which has already stalled in the Senate. At the same time, existing regulations may be harder to reverse under divided government — slower new legislation, but also less risk of sudden reversals. Traders should also note that final official results may take days as mail-in ballots are counted.
The macro calendar does not pause for politics. AMD reports earnings after the close on election day, the October jobs report lands on Friday, and the November CPI reading follows later in the month. Bitcoin's next 72 hours are shaped by all of these at once, as our earlier analysis of Bitcoin's next 72 hours laid out. Any one of them can override the election narrative for a day — but none of them changes the historical pattern on its own.
Three Scenarios for the Next 12 Months
Predictions are not facts, and the scenarios below are labelled as scenarios, not forecasts. They are built from the levels the market is actually watching — $75,597 support, $76,450 200-day average, $78,661 resistance — combined with the historical midterm pattern.
| Scenario | Trigger | Price path (illustrative) | What to watch |
|---|---|---|---|
| Bear: the midterm dip extends | ETF outflows continue, $75,597 breaks, Binance withdrawals accelerate | A move toward $72,000–$70,000 before any low forms, consistent with the 13–71 day window | Daily ETF flows, IBIT redemptions, Binance net outflows |
| Base: history repeats | A choppy low forms by January, then a gradual recovery as ETF flows stabilize | Consolidation near $76,000–$80,000, then a climb toward $90,000+ over 12 months, in line with the 53.7% average | ETF flows turning positive, Friday's jobs report, November CPI |
| Bull: the surprise breaks upward | A Republican surprise, or a fast ETF inflow reversal, plus a reclaim of $80,287 (50-day average) | A quick reclaim of $78,661, then $87,823 (50% Fibonacci) and the 100-week average near $89,134 | Election result surprise, options volatility collapsing after November 4, short liquidations |
The base case deserves a warning label. An average of 53.7% is not a promise: it is the mean of three very different recoveries, each driven by its own cycle, and the sample size is tiny. The 2010 midterm, excluded from that average, saw a 1,579% gain from a market so small it tells us nothing about today. Anyone quoting the 53.7% figure without the sample-size warning is selling you something.
What This Means for Your Money
First, do not confuse election night with the investment decision. If the historical pattern holds, the worst prices of this episode may still be ahead, arriving between mid-November and mid-January. That does not mean you should try to time the exact low — nobody has ever done that reliably, and the 2022 example shows the low can arrive in 13 days when a crisis accelerates it. It means position sizing matters more than prediction right now: money you cannot afford to see fall 20% further should not be fully deployed into a market sitting on its 200-day average with ETF outflows running.
Second, watch flows, not headlines. ETF flows have been the best real-time gauge of institutional demand in this sell-off: $643 million out on October 30, $399 million out on November 2, with BlackRock's IBIT accounting for more than the entire net outflow on Monday. A run of positive flow days would be the earliest sign the base case is forming; continued nine-figure outflows would support the bear case.
Third, get the basics right before chasing the cycle. If you are new to Bitcoin, start with what Bitcoin actually is and how it works, then read how to buy Bitcoin safely as a beginner. If you already hold, the question is custody: after a $6.3 billion exchange hack, the difference between coins on an exchange and coins in a wallet you control is not theoretical. Our comparison of hot versus cold wallets and the Bitcoin versus stocks comparison both help frame whether this dip is a buying opportunity or a warning, depending on your time horizon.
Fourth, remember what most people get wrong about midterms. The common mistake is assuming the election result itself decides Bitcoin's price. The evidence says something subtler: elections coincide with cycle turning points, but halvings, liquidity, ETF flows and crises do most of the work. Trade the levels and the flows, not the party labels.

What Most People Get Wrong About Post-Election Bitcoin
The myth is that Bitcoin rallies because a new Congress is "good for crypto." The reality in the data is messier: Bitcoin fell first after every midterm, then recovered for reasons that had at least as much to do with the halving cycle and global liquidity as with Washington. Another myth is that prediction markets are forecasts — a 72% Polymarket price for a Democratic sweep is a betting price, not a fact, and it moved sharply over the final weekend. A third myth is that ETF outflows mean institutions have abandoned Bitcoin: the same week ETFs lost over $1 billion, Strategy spent $65.5 million buying above the market price, and ETF holders' average cost basis sits near $81,700 according to Bloomberg estimates cited in market commentary — meaning many ETF holders are near breakeven, not capitulating from deep losses. Outflows at breakeven look very different from outflows in panic.
Finally, do not ignore the calendar beyond the election. The jobs report on Friday and November CPI later this month will matter more for the Federal Reserve's path than any House race, and rate expectations have been a co-driver of every Bitcoin drawdown this year. The midterm pattern is a tailwind for patient holders, not a shield against macro shocks.
Frequently Asked Questions
Does Bitcoin always go up after midterm elections?
No — and that is the most important nuance in this article. Bitcoin has fallen after every midterm since 2014, by 65% in 2014, 52% in 2018 and 27% in 2022. The bullish part of the pattern is the 12 months after the vote, which averaged a 53.7% gain across the past three cycles. The sequence matters: dip first, recovery second.
When has Bitcoin bottomed after past midterms?
71 days after the 2014 vote, 39 days after the 2018 vote and 13 days after the 2022 vote. From November 3, 2026, that range points to a window between mid-November 2026 and mid-January 2027 — if the pattern repeats. The 2022 gap was shortened by the FTX collapse, so it should not be treated as the normal case.
Why is Bitcoin down around $76,900 right now?
Several pressures landed together: the $6.3 billion Binance hack on October 29, $4.72 billion in Binance customer withdrawals since reopening, $643 million in ETF outflows on October 30 and $399 million more on November 2, plus pre-election caution and a weak October for tech stocks. No single cause explains the whole decline.
What price levels should I watch next?
Support at $75,597 (the 50-week average), the rising 200-day average near $76,450 that price is sitting on now, resistance at $78,661 (61.8% Fibonacci retracement), and the 50-day average near $80,287. A sustained break below $75,597 would support the bear scenario; a reclaim of $80,287 would flip momentum back toward buyers.
Do midterm results actually cause Bitcoin's moves?
Probably not directly. The halving cycle offers a competing explanation: bear markets bottomed in midterm years (2014, 2018, 2022, 2026) because of the four-year cycle, not because of voting. Grayscale also notes the US is only 15–20% of global crypto activity. Treat the midterm pattern as a seasonal tendency, not a causal law.
Should I buy Bitcoin now or wait?
There is no one-size answer, and this article is not financial advice. History suggests the post-election weeks have been a poor time to chase and a better time to accumulate gradually, but past patterns do not guarantee future results. Decide based on your time horizon, your risk tolerance and whether your coins are held in self-custody — not on election-night headlines.
Conclusion
Election night 2026 finds Bitcoin at a crossroads that history has marked before: near $76,900, sitting on its 200-day average, with ETF holders selling, Strategy buying, Binance still bleeding withdrawals, and a Congress about to change hands. The historical record offers two truths at once. The short-term truth is uncomfortable: Bitcoin has fallen after every midterm, and the cycle low has taken 13 to 71 days to arrive. The longer-term truth is encouraging: the 12 months after those votes averaged a 53.7% gain, and the S&P 500's post-midterm record stretches back to 1950. Neither truth is a guarantee. But together they argue for the same discipline that has worked through every previous cycle: respect the dip window, watch ETF flows instead of headlines, keep your custody sound, and let the levels — $75,597 below, $78,661 and $80,287 above — tell you which scenario is actually unfolding.
Sources: CoinDesk's midterm history analysis, CoinDesk's November 3 market report, Bitcoin.com's midterm bottom pattern, Bytick's midterm market preview, and Invezz on ETF outflows and the $75,597 support level, with ETF flow data from Farside Investors and SoSoValue as reported by CoinDesk and CoinJuice. This article is for information only and is not financial advice.