XRP Price: Options Traders Price an 8.7% Move by November 8 — 5 Levels That Decide $1.14 or $1.36
XRP options are pricing a ±8.7% move through November 8 — the widest volatility premium of any major coin — while XRP itself sits flat at $1.25. Here are the 5 levels that decide whether that move lands at $1.14 or $1.36.
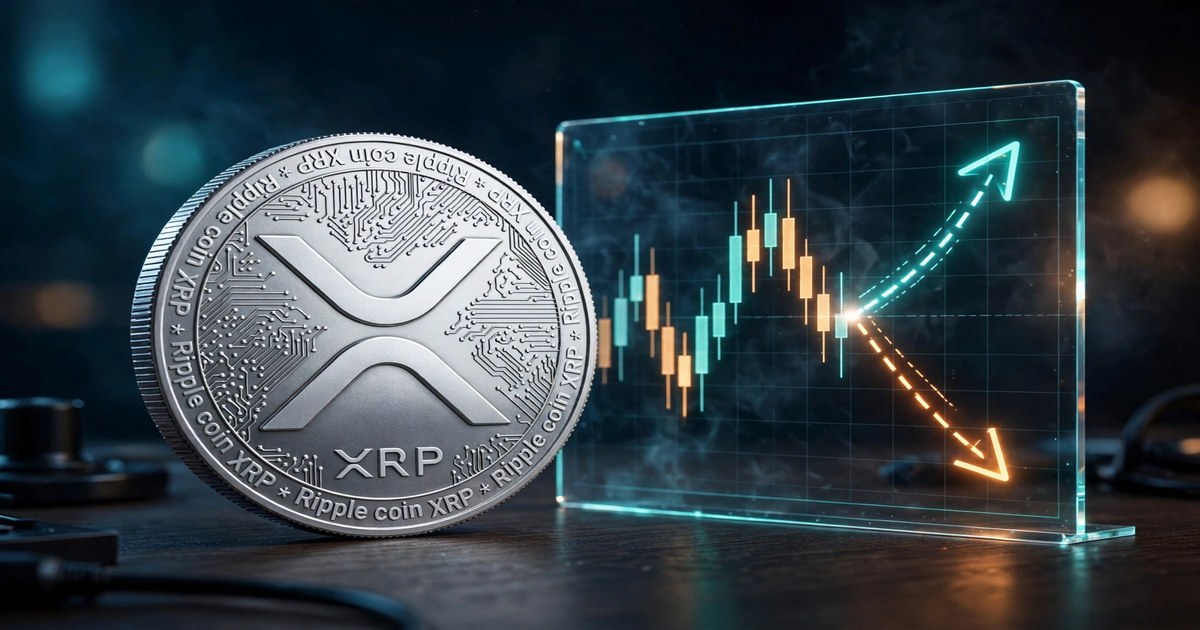
XRP options traders are pricing a move of about 8.7% in either direction through November 8 — the largest volatility premium of any major cryptocurrency — even while XRP itself has barely moved, sitting near $1.25. In plain terms, the options market is saying a quiet coin is about to stop being quiet, and it does not know which way it will jump.
That single number is the story: a move of 8.7% from $1.25 would put XRP at roughly $1.36 on the upside or $1.14 on the downside, and the premium traders are paying is far larger, relative to XRP's normal weekly swings, than for Bitcoin, Ethereum or Solana.
This is not a prediction that XRP will rise or fall. An options-implied move is a measure of expected turbulence, not direction — and confusing the two is the most expensive mistake traders make with this kind of data.
What the options market is actually saying
According to Coinbase Markets data reported on November 3, XRP options are pricing an approximately 8.7% move through November 8. The calculation uses at-the-money implied volatility and the time remaining until that date, and it describes the size of move the market considers plausible over the next seven days — up or down, with no bias either way.
What makes the reading striking is not the 8.7% alone. Solana carries the same 8.7% implied move, yet XRP's premium over its own history is far wider. XRP's median absolute seven-day move is only about 4.9%, so the current pricing sits roughly 1.76 times above normal. That is the widest relative premium among the four major assets tracked, and it is the reason this story matters more for XRP than for the coins with similar absolute numbers.
Put simply, XRP traders are paying up for protection and speculation at a rate they do not normally pay, even though the spot price has gone almost nowhere. When a market pays an unusual premium for uncertainty while the price stands still, something is usually about to resolve — a catalyst, a technical break, or a shift in positioning.
How XRP compares with Bitcoin, Ethereum and Solana
The comparison below, based on the same Coinbase Markets data, shows why XRP stands out. The absolute implied move is only half the picture; the premium over each coin's own typical weekly move is what reveals where traders are most nervous relative to normal conditions.
| Cryptocurrency | Implied 7-day move | Median 7-day move | Premium over normal |
|---|---|---|---|
| XRP | 8.7% | 4.9% | 1.76x — widest of the four |
| Bitcoin (BTC) | 5.8% | 3.5% | 1.66x |
| Ethereum (ETH) | 7.7% | 5.1% | 1.51x |
| Solana (SOL) | 8.7% | 6.5% | 1.34x |
Read the table from right to left and the message sharpens: Solana normally swings about 6.5% a week, so its 8.7% is only about a third above normal, while XRP combines a large absolute move with a small normal range — which is why its 1.76x premium tops the list.
What an 8.7% move means in dollars
Percentages hide the real stakes, so here is the arithmetic from XRP's current reference price of about $1.25. These are calculations from that price, not targets published by Coinbase or any exchange — the options data gives the percentage, and the dollar levels follow from it.
| Scenario | Move from $1.25 | Resulting price | What it would mean |
|---|---|---|---|
| Full upside move | +8.7% | About $1.36 | Back above both the 50-day and 200-day averages |
| Half upside move | +4.35% | About $1.30 | Into the overhead trendline zone near $1.29 |
| No move | 0% | About $1.25 | Still inside the $1.24–$1.25 support region |
| Half downside move | −4.35% | About $1.20 | Below support, toward the next downside zone |
| Full downside move | −8.7% | About $1.14 | A sharp break, but still above the $1.00 danger zone |
Notice what the table does not show: an 8.7% move in either direction does not, on its own, take XRP to $1.00 or to a new high. The full downside case lands near $1.14, while the full upside case lands near $1.36 — roughly where the longer-term moving averages sit. That framing matters because headlines about "big moves" often imply far larger outcomes than the data actually supports.
For context, XRP was trading at $1.25 on November 3, with Solana near $92, Ethereum near $2,250 and Bitcoin near $76,500–$76,800, as markets digested the fallout from the $6.3 billion Binance hack and voted in the United States midterm elections. XRP's near-flat 24-hour performance stood out precisely because its options market was pricing anything but flat.
Why the premium is so wide right now
Four forces are colliding in the same seven-day window, and together they explain why traders are paying up for XRP volatility even while the spot price drifts.
1. A week packed with catalysts
November 8 is not an arbitrary date. Between now and then, the market must absorb the results of the November 3 United States midterm elections, the Bank of England rate decision on November 5, and the United States jobs report on November 6. Any one of those can move risk assets; stacked together, they give options traders a reason to price a bigger-than-normal week across the whole crypto market, not just XRP.
Some analysts argue the midterm fear is overblown, noting that post-midterm years have historically been kind to markets and that the correction may already be priced in. That debate itself is a source of volatility: when smart money disagrees about whether an event matters, options premiums tend to rise until the event passes and the argument is settled by the price.
2. XRP is coiled at technical support
Technically, XRP is sitting on support that has dominated recent setups: the $1.24–$1.25 zone. At the same time it trades below both the 50-day exponential moving average near $1.3365 and the 200-day average near $1.3657, with an overhead trendline connecting the September 23 and October 28 highs sitting near $1.2881. The relative strength index reads around 37 — soft, but not extremely oversold.
That combination — price pinned to support, resistance stacked just above, momentum neither panicked nor healthy — is exactly the kind of coiled setup where a modest catalyst can produce a larger-than-expected move. Traders are not necessarily betting on a breakout; they are betting that the coil will not stay coiled for another week.
3. ETF flows are sending mixed signals
XRP spot ETFs recorded only about $529,510 in outflows on Monday, a small figure next to the selling seen elsewhere. Solana ETFs, by contrast, recorded $71.47 million in outflows last week, marking a fourth consecutive week of heavy redemptions. Bitcoin ETFs lost $399 million on November 2, and Ethereum ETFs lost $140 million the same day, for a combined $539 million exit.
The contrast matters for XRP holders. XRP is not seeing the same institutional exit pressure as its peers, yet its options premium is the widest. That disconnect — calm fund flows, nervous options market — suggests the volatility pricing is driven more by event risk and technical positioning than by an ongoing institutional sell-off in XRP itself.
4. Sentiment is bearish, but not capitulating
On-chain analytics firm Santiment noted that the Binance hack predictably worsened crypto sentiment, with Bitcoin recording 0.69 bullish comments for every bearish comment and XRP at 0.61. Readings below 1.0 mean bearish comments outnumber bullish ones. Historically, Santiment argues, when sentiment stays below 1.0 while prices stop making new lows, a mid-term relief rally becomes more likely — though that is a pattern, not a promise.
The Crypto Fear and Greed Index has also stayed in fear territory, in the low 30s since the Binance hack. Fear alone does not cause rallies, but it does mean positioning is defensive, and defensive positioning can unwind quickly if a feared event passes without damage.
Five levels that decide $1.14 or $1.36
Forget trying to predict the direction. Watch these five levels instead — they are where the options-implied move will either confirm itself, fail, or extend into something bigger.
Level 1: $1.24–$1.25 support
This is the floor of the current range and the level XRP must hold for any bullish case to survive. A daily close below $1.24 would confirm that the support zone that has dominated recent technical setups has given way, opening the path toward the half-move downside near $1.20 and then the full implied move near $1.14.
Level 2: $1.2881 trendline resistance
The overhead trendline connecting the September 23 and October 28 highs sits near $1.2881. A move up that stalls here would leave XRP still trapped in its corrective pattern, even if the headline move looks impressive. Clearing it on strong volume is the first real evidence that the upside case is more than a bounce.
Level 3: $1.3365, the 50-day average
The 50-day exponential moving average near $1.3365 is the next ceiling. It sits just below the full upside implied target of about $1.36, so reaching it would mean most of the priced-in move has already happened. Traders who bought the upside expecting a run to $1.50 or beyond would need something beyond the options data to justify holding past this level.
Level 4: $1.3657, the 200-day average
The 200-day average near $1.3657 is the level that would turn a volatility event into a trend change. XRP has been trading beneath both major averages, and reclaiming the 200-day average would be the first sign that the broader corrective tone has shifted. The full 8.7% upside move lands almost exactly here, which is why $1.36 is a more meaningful target than a round number like $1.40.
Level 5: $1.00, the line the options data does not price
The most important level may be the one the options market is not pricing at all. Analysts have flagged $1.00 as the risk level if the current support zone fails decisively — a move of roughly 20% from $1.25, far beyond the 8.7% implied move. That gap is a reminder of the limits of seven-day options data: it prices the coming week, not the coming month, and a break of $1.24 could eventually lead somewhere the current premium does not cover.
What most people get wrong about implied moves
Three misunderstandings turn useful options data into costly trades, and all three are circulating around this XRP reading.
First, an implied move is not a forecast. Options traders are not collectively predicting that XRP will move 8.7%; they are pricing insurance and speculation so that, on average, the premium collected covers the risk taken. The actual move could be 2%, 8.7%, or 15% — the implied figure is the market's breakeven for volatility, not its destination.
Second, a wide premium does not mean traders are bullish. A high implied volatility reading can reflect heavy demand for downside protection just as easily as upside speculation. In XRP's case, the premium is widest while spot ETF flows are calm and sentiment is bearish, which points at least as much to hedging as to optimism.
Third, the premium can collapse even if the price moves. If the midterm results and the jobs report pass without surprises, implied volatility typically falls sharply — a phenomenon options traders call volatility crush. A trader who buys options purely because the premium is high can lose money even when they get the direction right, if the move arrives after the premium has already deflated.
Checklist: seven checks before trading the November 8 window
- Confirm the position size assumes the full 8.7% move in the wrong direction, not just the hoped-for direction, before any trade is placed.
- Check whether the trade profits from the move itself or only from a rise in volatility, because those are two different bets with different outcomes.
- Note the expiry: options priced through November 8 lose their event premium once the catalysts pass, even if XRP is still moving.
- Watch the $1.24–$1.25 support zone on a daily close basis, not on a brief intraday dip, before declaring a breakdown.
- Require a close above the $1.2881 trendline before treating an upside move as a breakout rather than a bounce inside a downtrend.
- Compare XRP's move with Bitcoin and Solana over the same window, because a move driven by the whole market is a different signal from an XRP-specific break.
- Keep most holdings in self-custody or on a trusted platform with a clear withdrawal plan, since volatility weeks are when exchange outages and panic decisions do the most damage.
That last point deserves emphasis after the Binance hack. With $4.7 billion withdrawn from Binance since withdrawals reopened and fresh attacks hitting other exchanges, the safest trade during a volatility window is often no trade at all on a platform you have not stress-tested. Readers who are new to XRP can start with our beginner guide to buying XRP, and anyone confused by fund flows should read how spot crypto ETFs actually work before treating a single day of flows as a trend.

What happens after November 8
Three paths cover most outcomes, and each has a different implication for XRP holders.
In the upside path, XRP clears $1.2881, reclaims the 50-day average near $1.3365, and tests the 200-day average near $1.3657 — the full implied move. That would not by itself prove a new bull run, but it would end the pattern of lower highs that has defined the recent correction and force short sellers to reconsider.
In the downside path, XRP loses $1.24–$1.25 support and trades toward $1.20 and then $1.14. That would confirm the bearish technical bias, keep XRP below both major averages, and bring the $1.00 risk level into conversation — not as an immediate target, but as the next line that matters if selling continues into the following week.
In the quiet path, XRP stays near $1.25 and the options premium collapses after the catalysts pass. That outcome would be the most instructive of all: it would show that a record relative premium can be a measure of fear about events, not a guarantee of price action, and that the options market's job is to price uncertainty, not to resolve it.
For broader context on how XRP got to this point, see our November XRP news roundup on custody, leveraged ETFs and the billion-token unlock, and for the other side of the volatility table, our Solana levels analysis after SOL lost its 200-day average. Readers weighing where to hold coins through a volatile week should also revisit our guide to the best crypto wallets for beginners.
Frequently asked questions
What does an 8.7% implied move for XRP mean?
It means options traders are pricing a move of about 8.7% in either direction through November 8, based on at-the-money implied volatility and the time remaining. From $1.25, that implies roughly $1.36 on the upside or $1.14 on the downside. It is a measure of expected turbulence, not a prediction of direction.
Why is XRP's volatility premium the widest among major coins?
Because XRP's median seven-day move is only about 4.9%, so an 8.7% implied move is roughly 1.76 times normal — wider than Bitcoin's 1.66x, Ethereum's 1.51x and Solana's 1.34x, even though Solana shares the same 8.7% absolute figure. The premium is measured relative to each coin's own history.
Does a high implied volatility reading mean XRP will go up?
No. High implied volatility can reflect demand for downside protection, upside speculation, or simply uncertainty about upcoming events such as elections and economic data. The options data gives the size of the expected move, not its direction, and traders lose money when they treat it as a buy signal on its own.
What price levels matter most for XRP before November 8?
Support at $1.24–$1.25, trendline resistance near $1.2881, the 50-day average near $1.3365, the 200-day average near $1.3657, and the $1.00 level that would come into play only if support fails decisively. The full implied upside lands near $1.36 and the full downside near $1.14.
How do XRP ETF flows fit into this picture?
XRP ETFs saw only about $529,510 in outflows on Monday, far smaller than Solana's $71.47 million weekly outflow or the combined $539 million Bitcoin and Ethereum ETF exit on November 2. Calm fund flows alongside a wide options premium suggest the volatility pricing is driven more by event risk and technical positioning than by institutional selling of XRP.
Should I buy XRP options because the premium is high?
That is usually the wrong reason. A high premium means options are expensive, so buyers need a large move just to break even, and premiums often collapse once the feared events pass. Anyone considering options should understand expiry, strike selection and volatility crush first, and should never risk money they cannot afford to lose. This article is educational, not financial advice.
Conclusion
XRP's options market has handed traders an unusually clear message: a quiet coin, a wide premium, and a week full of catalysts. The 8.7% implied move through November 8, and its 1.76x premium over XRP's normal weekly range, is the widest relative volatility pricing among the major coins — and it arrives while XRP sits flat at $1.25, below both its major moving averages, on support that has to hold.
The smart response is not to guess up or down. It is to watch the five levels — $1.24–$1.25, $1.2881, $1.3365, $1.3657 and $1.00 — to size any position for the full move in the wrong direction, and to remember that an implied move prices uncertainty, not destiny. If XRP clears $1.36, the correction's grip loosens. If it breaks $1.14, the $1.00 conversation begins. If it does neither, the premium itself was the story — and the market, as it so often does, will have charged a high price for fear that never arrived.
Sources: The Crypto Basic on XRP options pricing, FXStreet on XRP, ADA and SOL technicals, CoinCentral on ETF outflows and the midterm vote, Analytics Insight on November 3 crypto prices.