Traders Bet $230 Million on a Bitcoin Rebound to $82,000 After the Election Dip — 5 Numbers That Decide If They're Right
Traders bought $230 million in Bitcoin call options as BTC bounced off $75,630 — but ETF sellers dumped $1.04 billion in two days. Here are the 5 numbers that decide whether the rebound reaches $82,000 or fails at $78,000.

Traders bought $230 million worth of Bitcoin call options on election day as Bitcoin staged a V-shaped recovery from $75,630 to nearly $78,000 — a bet that the worst of the sell-off is over and that an oversold bounce could carry BTC toward $82,000. The catch: while options traders were buying the rebound, spot Bitcoin ETF holders were still selling, dumping more than $1.04 billion in just two sessions. One side of the market is betting on a recovery. The other is still heading for the exit. This article breaks down the five numbers that will decide which side is right — before Friday's jobs report forces the issue.
Bitcoin fell as much as 2.8% in Asia trading on Wednesday, November 4, to $75,630.57, its lowest level since September 17, as early US midterm results showed Democrats winning control of the House and closing in on the Senate. It then erased its early losses and traded around $77,800, up about 0.5% on the day, as clearer results eased political uncertainty. That round trip — down more than $2,000 overnight, then back up almost $1,700 — is the whole story of this market in one session: fragile sentiment, fast selling, and buyers still willing to step in at the lows.
If you are new to how Bitcoin trades, start with our guide to what Bitcoin is and how BTC works before you trade any of the levels in this article. And if you are thinking about buying the dip yourself, read how to buy Bitcoin safely as a beginner first — the checklist there matters more when volatility is this high.
What actually happened overnight
Between 21:45 and 03:10 UTC, Bitcoin fell from about $77,970 to $75,740 as midterm results rolled in, according to Bitcoin.com's overnight coverage. Nasdaq 100 futures dropped about 2% at the same time after NBC News projected Democrats would win control of the House, and the Nikkei lost 3.5%. The dollar and Treasury yields fell as the market priced in tougher oversight of tech and the end of hopes for the CLARITY Act, the crypto market-structure bill that now looks dead for two years after the Democratic sweep, as we covered in our midterm results analysis.
Then the mood flipped. CoinDesk reported that Bitcoin rebounded from below $76,000 to trade 0.5% higher on Wednesday as analysts said clearer election results eased political uncertainty, and that Nasdaq futures also pared their decline to just 0.3% after falling more than 2% earlier. Bitcoin's 24-hour range stretched from $75,736 to $78,063, and by the European morning it was trading near $77,400, up 0.9% over 24 hours. The Fear and Greed Index stood at 34, firmly in "fear" territory — which is exactly when oversold bounces tend to happen, and exactly when they tend to fail.
This was not an isolated wobble. Bitcoin is down roughly 6% from its high last Thursday, before the $6.3 billion Binance hack, and about 39% below its all-time high of roughly $126,080 set on October 6, 2025. Over 30 days it is down about 10%, and over the past year about 24-27% depending on the data feed. The overnight dip was the latest leg of a slide that began with the hack, accelerated through ETF outflows, and then met election-night politics head-on. For the full overnight timeline, see our report on the crash to $75,630 and the $1,700 bounce.
Number 1: $230 million in call options — the rebound bet
The single most striking number from election day is $230 million: the value of Bitcoin call options traders bought as the price recovered, according to CoinDesk. Call options are bets that the price will rise — buyers pay a premium for the right to buy Bitcoin at a set price by a set date, so they profit if BTC rallies and lose only the premium if it does not. Election-day options block trading more than doubled from the previous day, which tells you this was not retail noise. Large traders were positioning, fast, for a bounce.
Why does that matter more than a spot price move? Because options traders put real money behind a direction, and they chose upside exposure at the exact moment sentiment looked worst. When a market is already down 39% from its high and the Fear and Greed Index reads 34, call buying is a contrarian signal: somebody with size believes the selling is exhausted, at least for now. It does not guarantee a rally — options buyers are wrong plenty of the time — but $230 million is not a shrug. It is a position.
There is a second options clue hiding in the calendar. CoinLab's daily brief noted a Deribit expiry on 5,022 BTC with a max pain level of $77,000 at 3:00 AM ET on November 4. Max pain is the price at which the most options expire worthless, and markets often gravitate toward it into expiry. Bitcoin trading right around $77,000-77,800 into that expiry fits the pattern: the options market was not just betting on a rebound, it was anchored near $77,000 while it did so.
Number 2: $82,000 — the oversold target
Markus Thielen, founder of 10x Research, told CoinDesk that Bitcoin's daily stochastics — a momentum gauge that shows when a price has fallen too far, too fast — suggested Bitcoin looked oversold and could climb toward $82,000. His quote is blunt: "Bitcoin is now oversold and should rally back towards the 82,000 level as its next target." The broader trend, CoinDesk added, remains consolidative below key resistance around $80,000-$82,000.
That $82,000 target is a prediction, not a fact. Oversold signals work best when the news flow stops getting worse, and this week it has been relentless: a record hack, two days of heavy ETF selling, and an election result the crypto industry did not want. But the mechanics are simple: short sellers buy back to lock in gains, sidelined buyers step in at watched levels, and a market that fell fast can recover fast — the V-shape from $75,630 is the early version of that.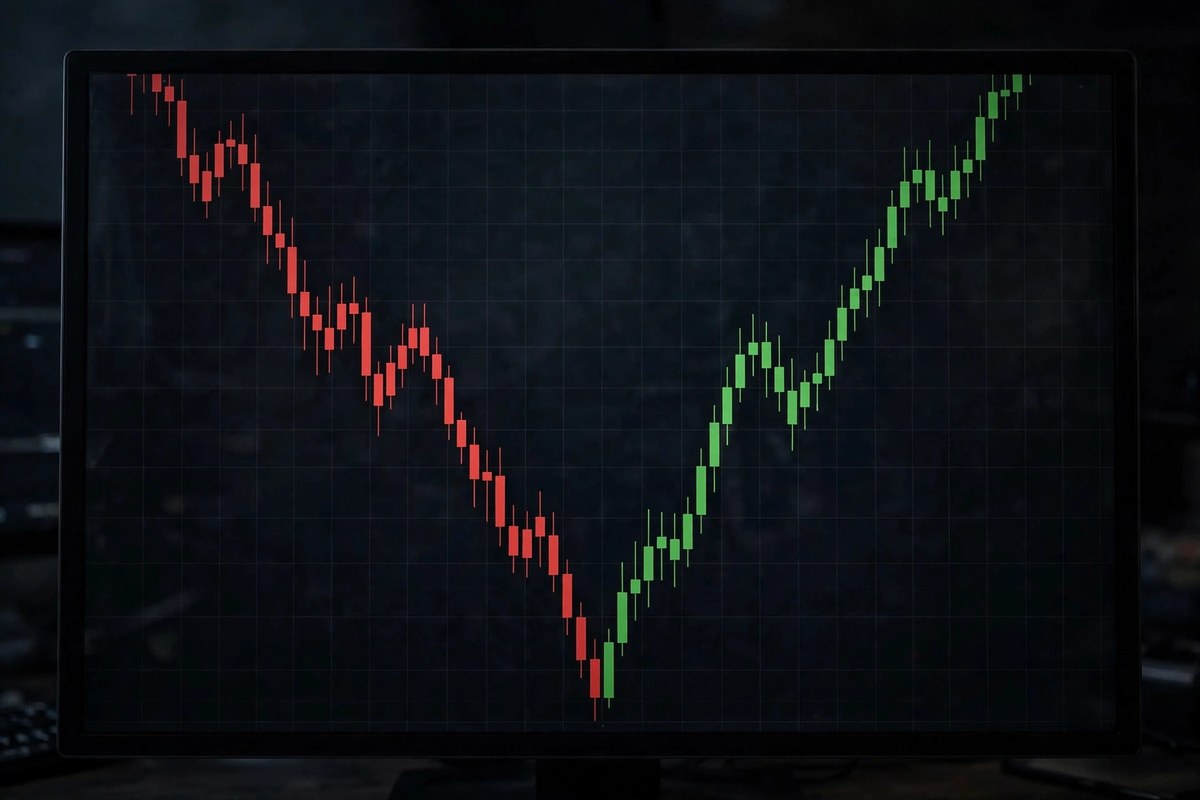
Number 3: $1.04 billion in ETF outflows — the sellers who have not stopped
Here is the number that should stop any victory lap. US spot Bitcoin ETFs recorded $398.6 million in net outflows on November 2, following $643.2 million on October 30 — more than $1 billion across two trading sessions, according to CNBC TV18 and Bloomberg data cited across the day's coverage. BlackRock's iShares Bitcoin Trust alone accounted for about $405 million of Monday's withdrawals. That selling wiped out all of 2026's net inflows into Bitcoin ETFs, as we detailed in our analysis of the $1.04 billion outflow.
ETF flows matter because they are the cleanest read on institutional demand. When ETFs bleed $1 billion in two days, it means regulated, larger investors are reducing exposure, not adding to it — the opposite of what the options market is betting on. And the selling did not start with the election: the $643.3 million outflow on October 30 was the largest since June 25, and it came the day after the Binance hack. The election dip poured politics on top of an exit that was already underway.
Our guide to how to read Bitcoin ETF flows explains why a single day of outflows is noise but five straight days of selling is a signal. By that standard, the current streak is a signal, and it is bearish until flows turn. The options bet and the ETF flows cannot both be the dominant force forever. One of them breaks first, and Friday's data may decide which.
Number 4: $76,000 and $78,000 — the two lines that decide everything
Strip away the narratives and Bitcoin's near-term fate comes down to two levels that analysts keep repeating. Support sits around $76,000-$76,300, with $75,000 as the next downside level to watch, according to BitDelta India's Purvang Mashru and WazirX founder Nischal Shetty, cited by CNBC TV18. Resistance sits at $77,000-$78,000 in the immediate term, then $79,500-$80,500, according to KuCoin's daily market report. Crypto.news analysts put immediate support near $76,400-$76,500, with resistance around $78,000 and $79,500 — essentially the same map.
Why do these levels matter? Bitcoin has now tested the $75,630-$75,740 zone twice in 24 hours and bounced both times. A level that holds twice earns credibility; a level that breaks on the third test tends to break hard, because its defenders give up and sell. On the upside, $78,000 is where the overnight recovery stalled, and $80,000-$80,500 is where the consolidation range tops out. A daily close above $80,000 would be the first real evidence the bounce has legs toward $82,000. A daily close below $75,000 would say the bounce failed and the ETF sellers are still in charge.
For longer-term holders, one more level is worth knowing. Bitcoin's 200-day exponential moving average sits near $76,450 and rising, and the 50-week moving average is near $75,602. Bitcoin is clinging to its long-term trend lines by a margin of barely 1%. That is why this week feels so binary: BTC is not drifting in the middle of a range. It is sitting on the floor of its long-term uptrend, and the floor is cracking.
Number 5: Friday's jobs report — the catalyst that overrides all of this
The US October employment report lands on Friday, November 6, and every analyst in Wednesday's coverage named it as the next major test. Add Thursday's Bank of England rate decision — a hike to 4% is expected, the first rise since 2023, as we covered in our Bank of England preview — plus Wednesday's US ISM Services index and ADP employment data, and you have three macro catalysts in three days. Options traders know this, which is part of why election-day block trading doubled: positions are being set before the data, not after it.
The jobs report cuts both ways. A weak report could strengthen the case for rate cuts and help Bitcoin push through $78,000 toward $80,000. A hot report could cement expectations of a December rate hike — markets are already fully pricing one — and send Bitcoin back through $76,000 toward $75,000 or below. Neither outcome is knowable in advance, which is why position size matters more than prediction this week.
Two counterweights deserve a mention. BlackRock's head of digital assets, Robert Mitchnick, said at the ETF Investor Forum on Tuesday that the midterms "will not change" BlackRock's crypto strategy — the firm manages roughly $75 billion across its crypto ETF products. And Arthur Hayes warned on November 3 that Bitcoin weakness could persist until the Federal Reserve or banks expand their balance sheets. Both can be true: the long-term institutional story is intact, and the short-term price still needs liquidity to turn.
Bull, base and bear: three scenarios from here
The table below is the honest way to read the $230 million bet. Each scenario names the trigger, the price path, and what would prove it wrong — so you can check the market against it day by day instead of trusting any single prediction, including the $82,000 call.
| Scenario | Trigger | Price path | What proves it wrong |
|---|---|---|---|
| Bull: oversold bounce runs | ETF outflows slow, Friday's jobs data is soft, BTC closes above $80,000 | $78,000, then $80,000-$80,500, then Thielen's $82,000 target | A daily close back below $76,000 |
| Base: sideways grind | Options expiry pins price near $77,000, ETF selling continues but slows, macro data is mixed | $75,500-$78,500 range, as CoinLab's base case put it, with choppy $1,000-$2,000 swings | A decisive close outside $75,000-$80,500 in either direction |
| Bear: bounce fails | Hot jobs data, another heavy ETF outflow day, $75,000 support breaks | Back through the $75,630 overnight low, with ETF sellers driving the next leg down | A close above $80,000 on strong ETF inflows |
The base case deserves the most weight right now, and not just because it is the middle option. CoinLab's overnight brief put the base case for the next 24 hours at sideways $75,500-$78,500 with 45% probability, noting that the overnight low was bought but ETFs have been selling for a fifth day. That matches the tape: buyers defend $75,630, sellers cap $78,000, and the market waits for Friday. Traders who bet $230 million on calls are betting the base case breaks upward.  ETF sellers are betting it breaks downward. The range itself is the market's current answer.
What most people get wrong about this rebound
The most common mistake after a V-shaped recovery is treating the bounce as proof the bottom is in. It is not. A $1,700 bounce after a $2,200 fall is a retracement, not a reversal — Bitcoin is still down about 4.3% over seven days and 9.2% over 30 days, and it is still below every level it lost last week. Reversals are confirmed by higher lows and by buyers returning in size, and the ETF data shows the opposite: the biggest buyers of the last two years just sold $1 billion in two days.
The second mistake is reading options flow as a prophecy. Call buyers can be hedgers, not speculators — a trader who is short Bitcoin in spot may buy calls to cap losses, which looks bullish in the flow data but is actually defensive. And $230 million in call notional is large, but it sits next to $25 billion-plus in daily Bitcoin trading volume and $88.83 million in liquidations over the last 24 hours alone. Options flow is a clue, not a verdict.
The third mistake is ignoring the calendar. Even if the $82,000 target is right, the path runs through Thursday's Bank of England decision, Friday's jobs report, and an options expiry that can whip prices for hours. Anyone buying the rebound thesis should expect at least one more sharp swing before Friday's close — and size their position for it.
What to watch next
Watch four things, in this order. First, Thursday's Bank of England decision and any signal about December rate expectations — a hawkish surprise would strengthen the dollar and pressure Bitcoin. Second, Friday's US jobs report at 8:30 AM ET, the single biggest scheduled catalyst of the week. Third, daily spot ETF flow data: one day of inflows after five days of selling would be the first sign the institutional exit is pausing, and two days would confirm it. Fourth, whether Bitcoin holds $76,000 on a daily close — that level, not any intraday wick, is the line between a bounce and a breakdown.
Stablecoins are a useful background gauge while you wait. Dollar-pegged stablecoin supply fell by $5.55 billion, or 1.84%, between October 27 and November 3, to $296.01 billion — money leaving the crypto system, consistent with the ETF outflows. When stablecoin supply stops shrinking, it usually means fresh capital is returning. Until then, the rebound is running on positioning, not new money.
FAQs
Why did Bitcoin fall to $75,630 on November 4?
Bitcoin fell as early US midterm results showed Democrats winning the House and closing in on the Senate, which hit stock futures and crypto together and ended hopes for the CLARITY Act market-structure bill. It dropped as much as 2.8% in Asia trading to $75,630.57, its lowest since September 17, before recovering as results became clearer.
What does the $230 million in call options mean?
Traders bought $230 million worth of Bitcoin call options on election day, betting the price would rise, with election-day options block trading more than doubling from the previous day. It is a sign that large traders saw the dip as oversold — but options bets are not guarantees, and some call buying can be hedging rather than outright bullish speculation.
Will Bitcoin reach $82,000?
10x Research founder Markus Thielen said oversold momentum signals point toward $82,000 as the next target, but that is a prediction based on technical indicators, not a certainty. Bitcoin first needs to clear $78,000 and then $80,000-$80,500, and Friday's jobs report could easily delay or derail the move.
Why are Bitcoin ETFs selling if traders are bullish?
Different investors, different time horizons. Spot ETF holders sold $1.04 billion across October 30 and November 2, wiping out 2026's net inflows, while options traders positioned for a short-term bounce. ETF flows reflect longer-term institutional allocation decisions; options flow reflects short-term positioning ahead of macro data.
What price levels matter most this week?
Support at $76,000-$76,300, then $75,000; resistance at $78,000, then $79,500-$80,500, then the $82,000 oversold target. A daily close below $75,000 would signal the bounce failed, while a daily close above $80,000 would signal it has legs.
Is this a good time to buy Bitcoin?
That depends on your time horizon and risk tolerance, and this article is not financial advice. Short-term traders face a binary week around the jobs report and the $76,000/$78,000 levels. Long-term buyers should focus on position size, secure storage, and whether they can hold through another $2,000 overnight swing without panic-selling — the same discipline covered in our beginner guides linked above.
Conclusion
The $230 million call bet is the most interesting number in crypto this week because it disagrees with the loudest number — $1.04 billion in ETF selling. One side sees an oversold market ready to bounce toward $82,000. The other sees an institutional exit that has not finished. Both have evidence, and Friday's jobs report will give one of them the upper hand. Until then, the honest position is the range: $75,500-$78,500, with $76,000 below and $78,000 above deciding the next move. Watch the ETF flows, watch the daily closes, and do not mistake a bounce for a bottom until the buyers who left start coming back.
Sources: CoinDesk, "Bitcoin knocks on $78,000. What next?" (November 4, 2026); The Business Times midterm coverage (November 4, 2026); CNBC TV18 via TradingView (November 4, 2026); Bitcoin.com overnight coverage (November 4, 2026); KuCoin Crypto Daily Market Report (November 4, 2026); crypto.news (November 3, 2026). Prices are snapshots from those reports and move by the hour; this article is not financial advice.