Bitcoin's $707 Billion Underwater Problem: Recent Buyers Just Fell Below $77,700 — 5 Numbers That Decide $75,832 or $68,400
Bitcoin worth $707B is now held at a loss and BTC just fell below the $77,700 cost basis of its newest buyers. Here are the 5 numbers that decide whether $75,832 holds or $68,400 comes next.

Bitcoin worth $707 billion is now held at a loss, while only $380 billion worth of coins remain in profit, according to CryptoQuant calculations reported on November 3, 2026. On the same day, Bitcoin fell below $77,700 — the average purchase price of investors who bought in the past one to three months — turning the market's newest buyers into underwater holders in a single session. The question for every holder now is simple and urgent: does this mark a bottom, like the last time a similar signal flashed, or the start of a deeper slide toward $68,400?
Bitcoin traded around $76,600 to $76,900 on November 3, down roughly 2% in 24 hours and more than 10% over four weeks, while the total crypto market fell to $2.57 trillion, its lowest level in six weeks. The selling was not driven by one event. Spot Bitcoin ETFs lost $398.6 million on November 2, their second straight day of outflows, with BlackRock's IBIT alone shedding $405.3 million — its largest daily outflow since June. Binance customers have withdrawn a net $4.72 billion since the exchange reopened after the $6.3 billion hack. And Americans went to the polls for midterm elections, an event that historically freezes risk-taking until results are known. This article separates what the on-chain data actually says from what the headlines imply, lays out the five numbers that decide the next move, and gives holders a clear checklist for the days ahead.
What Just Happened: Bitcoin Falls Below Its Newest Buyers' Cost Basis
On-chain analytics firm CryptoQuant tracks a metric called the Trader Onchain Realized Price, which measures the average price at which coins last moved for investors who entered the market between one and three months ago. That cost basis currently stands at $77,700. On November 3, Bitcoin traded below it — around $76,500 to $76,900 — after holding above it since August 19. As Cointelegraph reported, citing CryptoQuant's analysis, a level that acted as support can now act as resistance, because underwater traders often use a return to breakeven as an opportunity to exit.
This is not a small cohort. One-to-three-month buyers are, by CryptoQuant's definition, speculative traders who react fastest to price swings. When they flip from profit to loss at scale, selling pressure tends to feed on itself: each bounce toward breakeven meets fresh supply from holders desperate to get out flat. That dynamic is exactly why the $77,700 level matters more than any round number like $75,000 or $80,000 this week. Round numbers are psychological; cost-basis levels are where real money changes hands.
The broader short-term holder cohort — wallets that have held coins for up to 155 days — is barely above water. Their aggregate cost basis is $75,832, giving a Market Value to Realized Value (MVRV) ratio of 1.012. In plain language, the average short-term holder is just 1.2% in profit. One more bad day pushes the whole cohort into net loss, and CryptoQuant's history shows what follows: once MVRV falls below 1.0, the next key zone is 0.85, described as "tactical capitulation" — the point where weak hands finally give up and, paradoxically, where sharp bottoms often form.
The $707 Billion Number, Explained Honestly
The headline figure — $707 billion of Bitcoin held at a loss versus $380 billion in profit — sounds catastrophic, and it is worth unpacking before panicking. These figures, calculated by CryptoQuant and reported by FXEmpire, measure the value of coins whose last on-chain movement was above today's price, versus those that last moved below it. They do not mean $707 billion has been lost. Unrealized losses only become real when holders sell, and long-term holders — the group that has historically refused to blink — are not the ones selling here.
What the number does prove is breadth. Nearly two-thirds of Bitcoin's circulating value by this measure is underwater, which means the pain is not confined to leveraged traders or late buyers. It spans the buyers of the entire autumn rally. That breadth matters because it changes market structure: with so many holders looking for an exit at breakeven, rallies face overhead supply at $77,700, then again at the ETF holders' average cost near $81,700. Any recovery must chew through those walls before it can run.
There is a second, quieter statistic hiding in the same data. The number of active addresses on the Bitcoin network has almost halved from its December 2024 peak, a decline comparable in scale to 2018, according to analyst Axel Adler Jr. Fewer active addresses does not mean Bitcoin is dying — long-term holding mechanically reduces activity — but combined with falling prices it signals that new users are not arriving to replace sellers. A market needs fresh buyers to absorb overhead supply, and right now the funnel looks thin.
5 Numbers That Decide $75,832 or $68,400
Strip away the noise and five numbers decide Bitcoin's next move. Watch them in this order, because each one triggers the next.
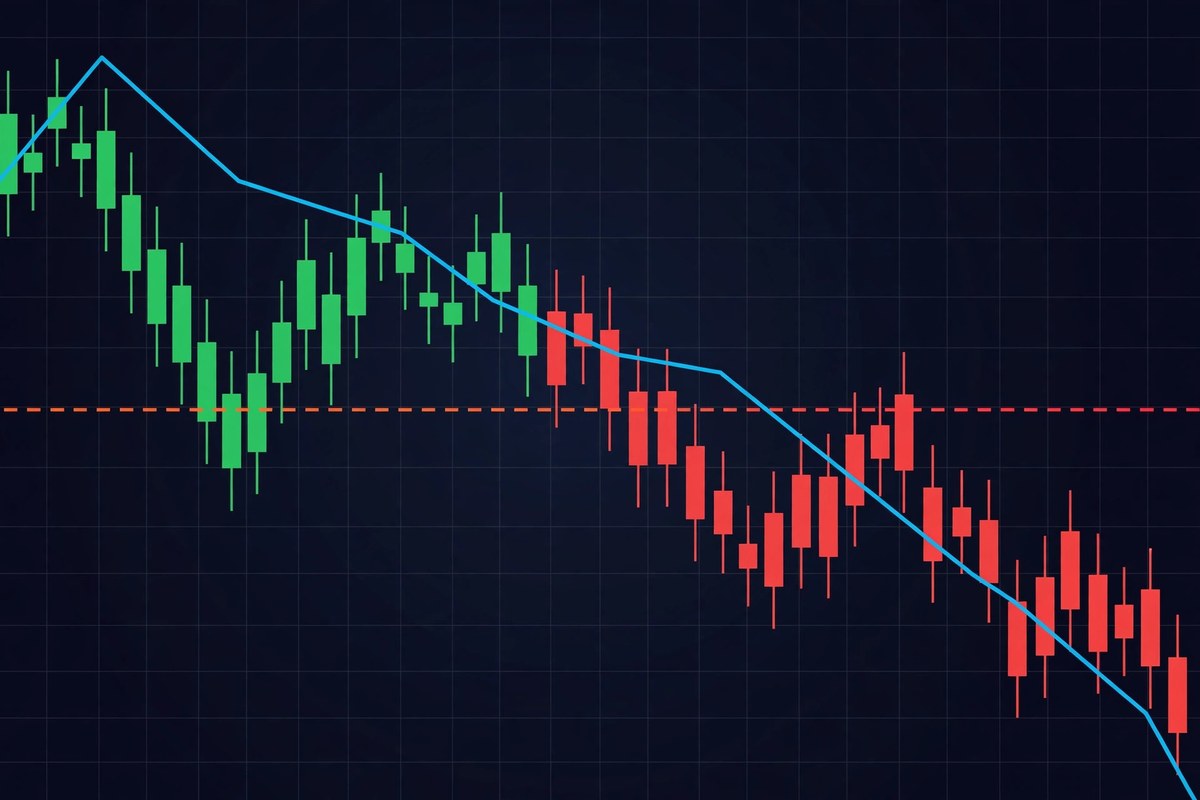
1. $75,832 — the short-term holder breakeven
This is the line between a normal pullback and a capitulation phase. Bitcoin traded just above it on November 3. Hold it, and the story stays "healthy correction inside a larger uptrend." Lose it, and the MVRV slide toward 0.85 begins, with forced selling from short-term holders accelerating the drop. Previous runs at this level recovered within weeks, but only after a washout first.
2. $77,700 — the new resistance
The one-to-three-month cost basis is now overhead resistance. Expect any bounce to stall here on the first attempt as underwater buyers sell into breakeven. A daily close back above $77,700 with rising volume would be the first real sign that sellers are exhausted. Until then, treat rallies toward it as selling opportunities for traders, not as all-clear signals.
3. $68,400 — the capitulation band
CryptoQuant's lower price band sits at $68,400, representing a 12% aggregate loss for recent buyers. The last time price fell through this band, at the start of June, it deviated as much as 12.6% below it over the following month before recovering in mid-August. If $75,832 fails, $68,400 is the realistic downside target — not $40,000, and not zero, but a painful 11% further fall from current levels.
4. $398.6 million — the ETF outflow that broke the bid
Spot Bitcoin ETFs lost $398.6 million on November 2, following $643 million on October 30, the largest single-day outflow since June. October ended with $515 million in net outflows, breaking a three-month streak of inflows. As CoinDesk reported, IBIT's $405.3 million single-day exit was its biggest since June. ETF flows matter because they were the market's largest buyer in the third quarter, adding $6.2 billion. When that buyer becomes a seller, prices have no floor until someone else steps in.
5. $4.72 billion — the Binance withdrawal wave
Binance customers have withdrawn a net $4.72 billion since the exchange reopened on November 2, up from $3.64 billion on the first day. Some of this is precaution after the $6.3 billion hack, not selling — coins moved to self-custody are not coins sold. But withdrawals still drain exchange liquidity and widen price gaps, and they coincide with a separate warning: Brazil's Mercado Bitcoin lost an estimated $40 million in a fresh attack. Security fears are compounding price fears, and that combination is what turns corrections into panics.
| Scenario | Trigger | Target | What it means for holders |
|---|---|---|---|
| Bull: sellers exhausted | Daily close above $77,700; ETF inflows return | $80,287, then $81,700 ETF cost basis | Overhead supply clears; the correction is over |
| Base: choppy range | Price holds $75,832 but fails at $77,700 | $75,832–$77,700 for days | Accumulate slowly; do not chase bounces |
| Bear: capitulation | Close below $75,832; STH MVRV under 1.0 | $73,000, then $68,400 | Final washout zone; historically a buying area, not a selling one |
What Most People Get Wrong About the Coinbase Discount
One of the most shared charts this week shows Bitcoin trading on Coinbase at its widest discount to Binance since the FTX collapse in November 2022. CryptoQuant's Coinbase Premium Index fell to roughly -0.2%, about a $156 gap at a $77,900 price, and CryptoQuant CEO Ki Young Ju noted that sentiment is "bearish enough to be bullish." The usual reading is simple: American investors are dumping. That reading is, right now, partly wrong — and understanding why could save holders from a costly mistake.

The discount is distorted by Binance itself. After the October 29–30 hack, Binance froze deposits and withdrawals, blocking the cross-exchange arbitrage that normally keeps prices aligned. As Galaxy Research head Alex Thorn explained, and as CryptoNews reported, the Coinbase discount temporarily stopped being a reliable signal of weak United States demand while transfers were blocked. Binance began a phased reopening of withdrawals on November 1, starting with Bitcoin and Ethereum, but a separate tracker put the discount streak at 59 straight days by November 2, with United States buyers paying 0.185% under the global price that day.
So which is it — genuine American selling, or a technical illusion? The honest answer is both, in sequence. The discount was already negative before the hack, reflecting genuinely cooling United States demand: ETF outflows, the October sell-off, and midterm caution all point the same way. The hack then exaggerated it by trapping liquidity on Binance. The test comes now: if the gap closes as Binance withdrawals normalize, the extreme reading was technical and the underlying United States demand picture is merely weak, not catastrophic. If the gap stays wide after transfers fully normalize, American selling is real and ongoing. Watch the premium index over the next five to seven days, not today's single print — that distinction is the difference between a smart trade and a panic sale.
The same caution applies to the FTX comparison itself. In November 2022, Bitcoin bottomed near $15,500 after the FTX collapse, and a four-year-low premium reading now does not predict the same outcome. Then, the discount reflected an exchange that had stolen customer funds and a market with no institutional bid. Today, spot ETFs, treasury buyers like Strategy — which bought 811 BTC at an average $80,846 in the week to November 1, taking its stack to 849,327 BTC — and regulated custody all exist. The signal rhymes; it does not repeat. Ki Young Ju's "bearish enough to be bullish" comment captures the contrarian read: extreme fear readings, with the Fear and Greed Index at 26, have historically marked zones where patient buyers, not sellers, were eventually rewarded — but only when they bought in stages, not all at once.
Why This Sell-Off Is Different From October's
October's sell-off had a single, visible cause: a hack and a liquidation cascade. November's pressure is broader and more institutional. ETF holders are selling, not just leveraged traders. Treasury buyers are still buying — Strategy and Strive both bought above current prices — but their purchases are dwarfed by ETF redemptions. Short-term holders sent more than 36,600 BTC to exchanges in a single day around October 30–31, one of the largest weekly flows of October, and realized losses hit $1.115 billion over October 30–31 against just $519 million in realized profits. Paper losses are becoming real losses, which is the mechanism that turns a dip into a downtrend.
Yet the long-term holder picture has not broken. Long-term holders have kept exchange deposits modest and dormant coin flows low, according to CryptoQuant data. That is the single most important divergence in this market: the people who have held through multiple cycles are not selling, while the people who bought in the last five months are. Markets bottom when the second group finishes selling and the first group starts buying again. The $75,832 level is where that transfer either happens or fails.
Macro timing adds a final twist. The United States midterm elections on November 3 decide which party controls the committees that will handle crypto legislation, including any revival of the stalled CLARITY Act, and the jobs report lands on November 6. CaptainAltcoin's November 3 breakdown notes that risk-averse investors typically hedge or withdraw until election results are clear. That means some of this week's selling may reverse quickly once results are known — but it also means volatility will stay extreme until then. Do not mistake election-week noise for a new trend in either direction.
Holder Checklist: 5 Moves Before the Next Big Level Breaks
- Check your own cost basis first: if you bought Bitcoin in the last one to three months, you are likely near breakeven or underwater — decide your exit or hold plan before price forces the decision, not during a red candle.
- Watch the $75,832 close, not intraday wicks: only a daily close below short-term holder cost basis confirms the capitulation path toward $68,400; intraday dips below it that recover are noise.
- Track ETF flows daily this week: a return to net inflows, even small ones, would be the earliest sign the institutional bid is back — outflows extending to a third and fourth day confirm the selling regime.
- Move coins off exchanges if security worries you: the Binance hack and the Mercado Bitcoin drain are reminders that exchange balances carry counterparty risk; self-custody removes it, but never share seed phrases with anyone claiming to help.
- Buy in stages if you buy at all: split any planned purchase across $75,832, $73,000 and $68,400 rather than going all-in at one level — capitulation bottoms are zones, not single prices, and catching the exact low is luck, not skill.
For readers new to these mechanics, our guides explain the building blocks: What Is Bitcoin? The Complete Beginner's Guide covers how cost basis and holder cohorts work in plain language, and What Is a Bitcoin ETF? explains why ETF creations and redemptions move spot prices. Recent coverage adds context on the forces at play: Bitcoin ETF Outflows Hit $739M in 7 Days debunks myths about the sell-off, and Bitcoin at $76,500 vs Strategy's Underwater Line tracks the treasury-buyer side of the same trade.
FAQs
Is Bitcoin crashing?
Bitcoin is down more than 10% over four weeks and about 39% from its $126,156 all-time high, which qualifies as a deep correction. It is not a crash in the structural sense: long-term holders are not panic-selling, exchanges are functioning, and no major institution has failed. A daily close below $75,832 would shift that assessment toward a capitulation phase, but even then the historical pattern is a washout followed by recovery, not a permanent collapse.
What does it mean that $707 billion of Bitcoin is underwater?
It means coins worth $707 billion last moved on-chain at prices above today's level, versus $380 billion that last moved below it, per CryptoQuant. These are unrealized positions, not realized losses. The figure matters because underwater holders create overhead supply: they tend to sell when price returns to their breakeven, which caps rallies until that supply is absorbed.
Should I sell my Bitcoin now?
There is no single right answer, and this article is not financial advice. The data says: short-term holders who sell now are selling into the weakest part of the cycle, near levels where capitulation historically forms. Holders who need the money soon, or who cannot tolerate a further fall to $68,400, should have a plan before that level is tested. Holders with a multi-year horizon have historically been rewarded for holding through exactly this kind of fear — but only if their coins are securely stored and they are not using leverage.
What is the Coinbase Premium Index, and why is it misleading right now?
The index measures the percentage gap between Bitcoin's price on Coinbase and on Binance. A negative reading means Bitcoin is cheaper on Coinbase, usually read as weak United States demand. Right now it is misleading because Binance's post-hack freeze on deposits and withdrawals blocked arbitrage, artificially widening the gap. Judge the signal again once Binance transfers have fully normalized for several days.
What happens if Bitcoin falls below $75,832?
The short-term holder cohort flips into net loss (MVRV below 1.0), and the next technical zone is MVRV 0.85, corresponding roughly to the $68,400 band. Historically, that zone has marked tactical capitulation — heavy selling followed by a bottoming process. It is painful for holders but has been a buying zone for patient accumulators, provided they buy in stages.
Could the midterm elections reverse the sell-off?
Possibly, in the short term. Election uncertainty typically suppresses risk-taking, and clarity — regardless of which party wins — often triggers a relief bounce. But elections do not fix ETF outflows, exchange security fears, or underwater holder supply on their own. Treat any post-election bounce as relief until it reclaims $77,700 on a daily close with ETF inflows behind it.
Conclusion
Bitcoin's $707 billion underwater problem is real, but it is not the whole story. The market's newest buyers are underwater, short-term holders sit just 1.2% above breakeven, and ETF sellers have replaced ETF buyers as the market's dominant force. Yet long-term holders are not selling, treasury buyers are still accumulating above current prices, and the most alarming signal of the week — the Coinbase discount — is partly a technical artifact of Binance's frozen transfers. The next five days decide which story wins: hold $75,832 and this is a correction that clears weak hands; lose it and $68,400 becomes the capitulation zone where the next cycle's buyers are made. Either way, the worst decisions in weeks like this are made in panic, at market, in a single trade. Check the five numbers, follow the checklist, and let the daily closes — not the headlines — tell you when the regime has actually changed.
Disclaimer: This article is for informational purposes only and is not financial advice. Cryptocurrency prices are volatile; never invest more than you can afford to lose.